
1.)What is your understanding of Triple Exponential Moving Average (TEMA)?
Triple Exponential Moving Average (TEMA) which was introduced in 1994 by Patrick G. Mulloy is one of the MA available and used in crypto trading.It is more advanced when compared to the other MA.It is designed in a way that it helps to easily and clearly identify trends by removing the inherent lags seen when using other MA's.This lag removal is achieved because TEMA uses multiple EMA calculation to subtract the lag.
Another Important thing is that TEMA smoothens the fluctuations in price.It helps a trader to identify and confirm trends,pull backs,resistance and support and to know when to enter and when to exit the market.For example when the price is above the TEMA line,it suggests that an uptrend.On the other hand,when the price is below the TEMA line,it suggests a downtrend.
Two TEMA can be used at different periods to make good buy and/or sell positions.If the lower period TEMA crosses the higher period TEMA,then buy position should be implemented and if the higher period TEMA crosses the lower period TEMA,then sell position should be implemented.

2.)How is TEMA calculated? Add TEMA to the crypto chart and explain its settings. (Screenshots required).
TEMA calculation is done with a formular.The formular involves 3EMA's.
TEMA = (3 × EMA1) - (3 × EMA2) + EMA3
Where👇
EMA1 = Exponential moving average
EMA2 = EMA of EMA1
EMA3 = EMA of EMA2
Each of the EMA's are set at the same period to obtain a uniform data or stat.
The difference between 3EMA1 and 3EMA2 is added to the EMA3 to obtain TEMA with smoothened price.

How to add TEMA to chart
To add TEMA to chart involves going to trading view via the link trading view.
Look up and select indicators
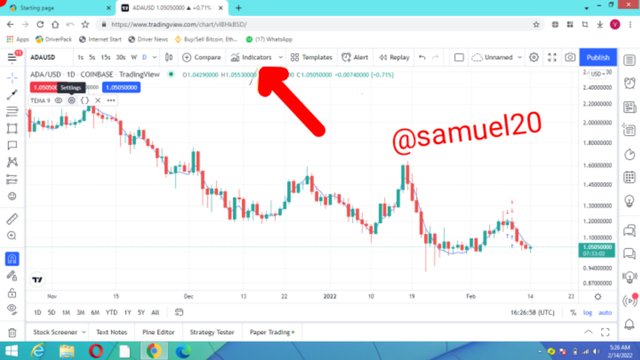
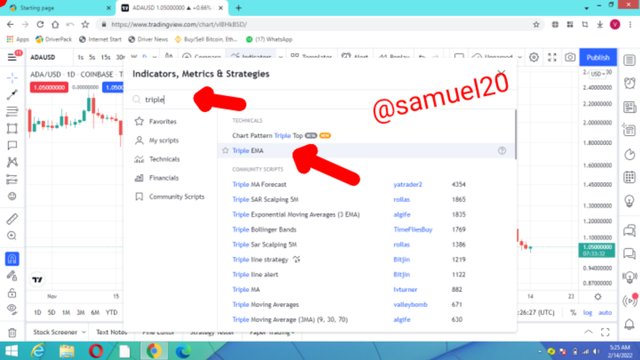
- In the search box enter triple exponential moving average and then select TRIPLE EMA.Now you have selected it.
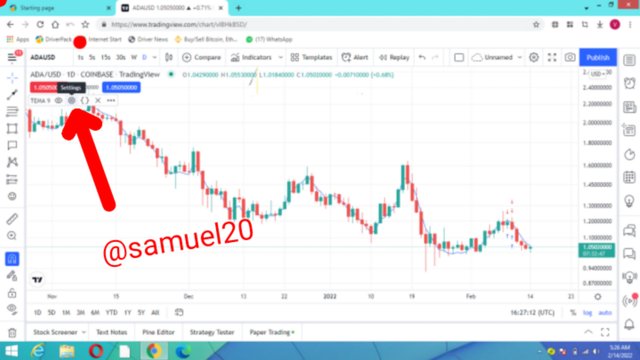
- You will see the symbol for settings,click on it and set the period and colour of the TEMA line.The default period is 9...I will set my period to 25 so that the TEMA line can clearly be seen and can be differentiated from the price line.
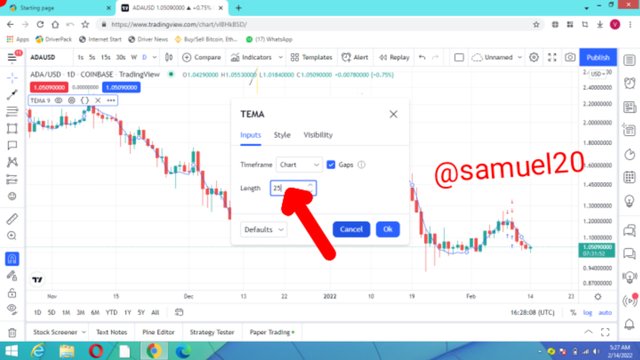

3.)Compare TEMA with other Moving Averages. You can use one or two Moving Averages for in-depth comparison with TEMA
A moving average (MA) is a technical indicator used by traders to determine the the direction of a trend.It adds the data points and divide it by the number of time period to get the average value.When MA is used to determine or confirm the direction of trend,the trader can now make proper decision as to know when to enter,take profit,stop loss and exit the market for both buy and sell position.MA is also used to determine support and resistance.However MA is regarded as a lagging indicator because it
uses previous price actions and so may not be very effective for future price determination.

Comparing TEMA with EMA
TEMA stands for Triple Exponential Moving Average while EMA stands for Exponential Moving Average.Both TEMA and EMA are types of moving averages(MA's) which serve as technical indicator to determine the direction of trend in the crypto chart.
TEMA is designed in a way to remove lagging which is observed in other MA's.This is because it uses multiple EMA calculation to remove the lag.Removing the lag helps to get the current trend at the moment.The TEMA also smoothens the fluctuations in price and so false signal leading to error is eliminated.
As for EMA,it gives more attention to recent price movement.It does not remove lag as in the case of TEMA.

Comparing TEMA with DEMA
TEMA stands for Triple Exponential Moving Average while DEMA stands for Double Exponential Moving Average.Both TEMA and DEMA are practically designed to get rid of lags which is prevalent in MA's.It is important to note that TEMA reduces kag more than DEMA.
TEMA involves taking multiple EMA of the original EMA to subtract the lag.By comparison,DEMA is calculated by multiplying the EMA of price by 2 then subtracting from the original EMA.

4.)Explain the Trend Identification/Confirmation in both bearish and bullish trends with TEMA (Use separate charts). Explain Support & Resistance with TEMA (On separate charts). (Screenshots required)

- Bullish Trend Identification/Confirmation Using TEMA
Bullish trend is when the price of the asset starts going up.It is a reversal from an downtrend to an uptrend.Bullish trend suggests a good time to buy because price is going up.
TEMA has proven to be a good indicator for identification and confirmation of bullish trend.To identify this bullish trend on a chart,the price and the TEMA will definitely angle up and to confirm this bullish trend,the price of the asset will start going up and will trade above the TEMA line as shown in the chart below.
.png)

- Bearish Trend Identification/Confirmation Using TEMA
Bearish trend is when the price of the asset starts going down.It is a reversal from from an uptrend to a downtrend.Bearish trends suggests a good time to sell(make a sell position) because price is going down.
No doubt,TEMA as a technical indicator is a good indicator for identification and confirmation of bearish trend.To identify this bearish trend on a chart,the price and the TEMA will definitely angle down and to confirm this bearish trend,the price of the asset will start going down and will trade below the TEMA line as shown in the chart below.
.png)

Explaining Resistance with TEMA
Resistance is a point where the price of an asset cannot go further up,instead it starts to go down which means there is trend reversal.It marks the end of an uptrend and the begining of a downtrend.Resistsnce is a time for traders to pull back and trade in the opposite direction (to set a sell position instead of a buy position).To identify and confirm resistance using TEMA,you will notice that the TEMA line will touch the price line and the price of the asset will start trading below the TEMA line.This is a reversal from uptrend to downtrend.
.png)

Explaining Support with TEMA
Support is a point where the price of an asset cannot go further down,instead it starts to go up which means there is trend reversal.It marks the end of a downtrend and the begining of an uptrend.Support is a time for traders to pull back and trade in the opposite direction (to set a buy position instead of a sell position).To identify and confirm support using TEMA,you will notice that the TEMA line will touch the price line and the price of the asset will start trading above the TEMA line.This is a reversal from downtrend trend to uptrend.
.png)

5.)Explain the combination of two TEMAs at different periods and several signals that can be extracted from it. Note: Use another period combination other than the one used in the lecture, explain your choice of the period. (Screenshots required).
For this question five.I will use two TEMA set at different periods on the same chart to determine the current trend and to know when to make a buy position or a sell position.This would be done by setting one TEMA at a lower period and setting the other at a higher period.
When the TEMA set at lower period crosses that of the higher period,then it means an uptrend will happen and so it is a good buy position.On the other hand,when the TEMA set a a higher period crosses that of the lower period,then it means a downtrend will happen and so it is a good sell position.
- For example in the chart below,I set the lower period at 30 and set the higher period at 65.You will notice that when the lower TEMA of 30(blue line) crossed the higher TEMA of 65(purple line).There was an uptrend which is good time to buy.
.png)
- For example in the chart below,I set the lower period at 30 and set the higher period at 65.You will notice that when the higher TEMA of 65(purple line) crossed the lower TEMA of 30(blue line).There was a down trend which is good time to sell.
.png)
I chose a period of 30 and 65 so that I can have a clearer trend such the the price line won't cover or absorb the TEMA line.I also don't want the two TEMA lines to absorb each other.

6.)What are the Trade Entry and Exit criteria using TEMA? Explain with Charts. (Screenshots required)
I am going to demonstrate trade entry and exit points using TEMA for both buy and sell positions.

Entry/Exit Buy Position using 2 TEMA
I will use two TEMA set at different periods to make a buy position.When the lower TEMA crossed the higher TEMA,it will lead to an uptrend and so I can make a buy position.I will wait for two candle confirmation and made an entry just after the crossing spot.
.png)
From the chart:
•Entry:$44,000
•Take profit:$44,140
•Stop loss:$43,970
- Then for the trade exit,I set a take profit above the entry level and set a stop loss just below the entry point.

Entry/Exit Sell Position using 2 TEMA
I will use two TEMA set at different periods to make a sell position.When the higher TEMA crossed the lower TEMA,it will lead to a downtrend and so I can make a sell position.I will wait for two candle confirmation and make an entry just after the crossing spot.
.png)
From the chart:
•Entry:$42,670
•Take profit:$42,550
•Stop loss:$42,700
- Then for the trade exit,I set a take profit below the entry level and set a stop loss just above the entry point.

7.)Use an indicator of choice in addition with crossovers between two TEMAs to place at least one demo trade and a real margin trade on an exchange (as little as $1 would do). Ideally, buy and sell positions (Apply proper trade management). Use only 5 - 15 mins time frame. (Screenshots required)

- Combination of MA and two TEMA to place a buy trade(demo trade)
After I have added MA indicator in combination with two TEMA,the lower TEMA(blue) crossed the higher TEMA(purple) and the MA(black) confirmed the uptrend too.This is an ideal time to place a buy position.I entered the market just after that point of crossing.I set my take profit above the entry price and then my stop loss just below the entry price.
.png)

From the BTCUSD chart:
•Entry:$44,337
•Take profit:$44,500
•Stop loss:$43,900
I have made a profit of +$3.38

- Combination of MA and two TEMA to place a sell trade(demo trade)
After I have added MA indicator in combination with two TEMA,the higher TEMA(purple) crossed the lower TEMA(blue) and the MA(black) confirmed the downtrend too.This is an ideal time to place a sell position.I entered the market just after that point of crossing.I set my take profit below the entry price and then my stop loss just above the entry price.
.png)

From the ETHUSD chart:
•Entry:$3156
•Take profit:$3150
•Stop loss:$3170
I have made a profit +0.54

- Combination of MA and two TEMA to place a buy trade(real trade)
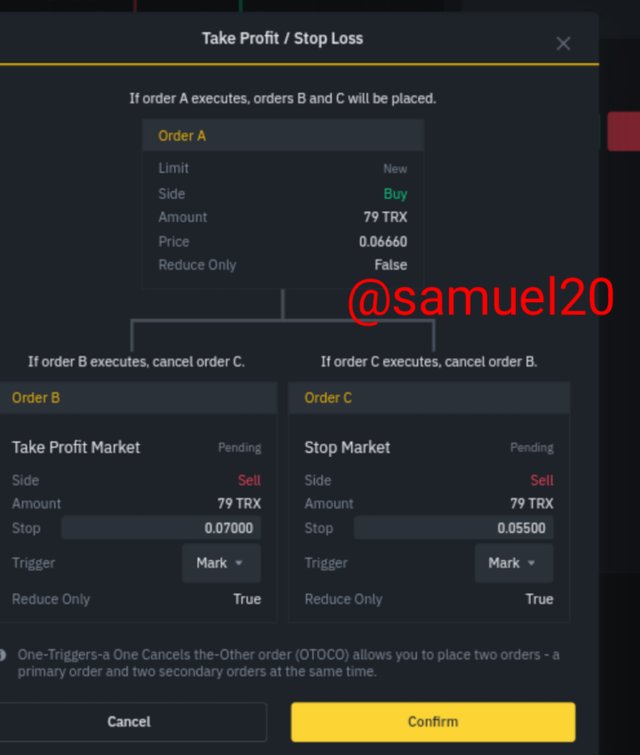
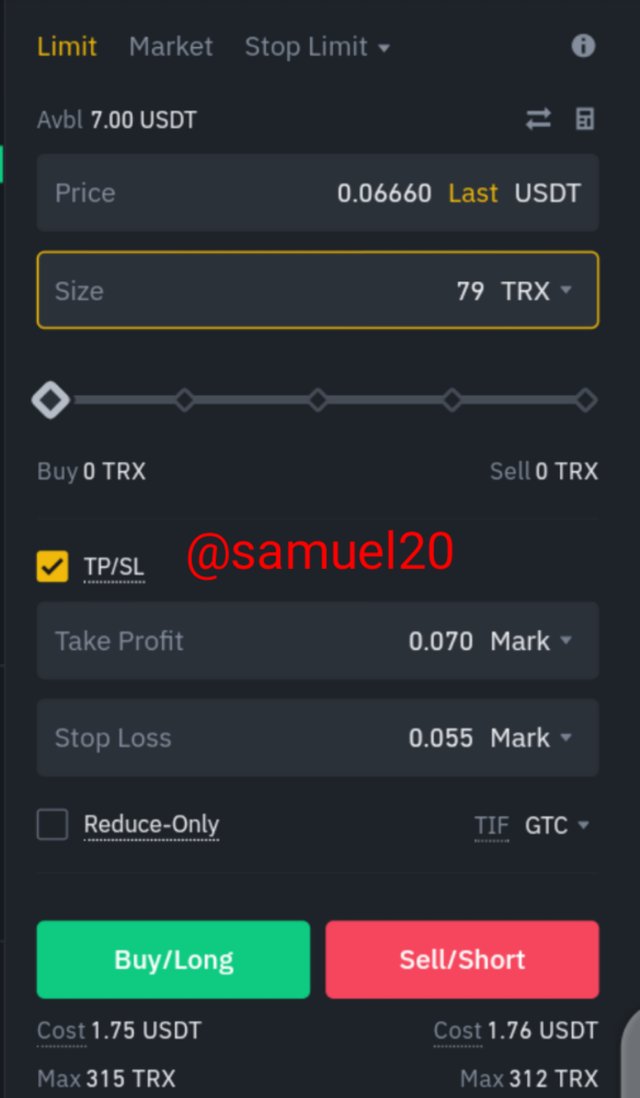
I noticed that the price will go up because the lower TEMA has crossed the higher TEMA and with the confirmation from the EMA. I place a buy position.Set the take profit above it and the stop loss below entry price.

- Combination of MA and two TEMA to place a sell trade(real trade)
I noticed that the price will go down because the higher TEMA has crossed the lower TEMA and with the confirmation from the EMA. I place a sell position.Set the take profit below it and the stop loss above the entry price.
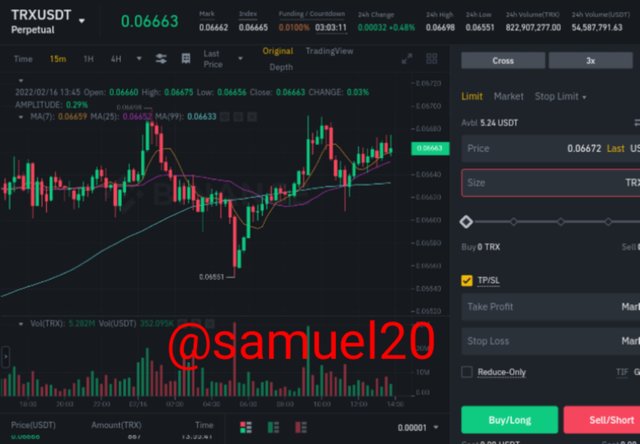
TrxUsdt chart


8.)What are the advantages and disadvantages of TEMA?
Advantages of TEMA
It is used to remove the inherent lags present in other MA's.It is helps to smoothen price fluctuations.
Combination of two TEMA can help to easily identify trends easily and clearer.
It helps to identify resistance,support,trend reversal and pullbacks.
- Disadvantages of TEMA
- Not all traders prefer using TEMA indicator
Some traders do not like reduced lags.
It can lead to a false signal when the price trend is weak.
Conclusion
The TEMA indicator is very important indicator is used to remove lag and to get the correct trends.It also helps to smoothen price fluctuations.This makes it different from other MA's that barely remove lags.Two TEMA can all be combined and set at different periods to identify good buy and sell positions.One can also use two TEMA with another indicator for trading too.Thanks to prof @fredquantum for the class.