Thank you prof @fredquantum for the class

In your own words, explain your understanding of On-Balance Volume (OBV) Indicator.
OBV indicator which stands for On-Balance Volume Indicator discovered by Joseph Granville in 1963 is a single line indicator that is used to predict the price of an asset with reference with the volume of buy/sell in the market.This means that it uses change in volume to make price predictions. It is a very important technical indicator that is used to confirm the presence of a bullish or a bearish trend.It is used to confirm the presence of a breakout away from the support or resistance level.Bearish and Bullish divergence are used also determined with the use of OBV indicator.
When the current trading volume is high,it is added to the to the previous OBV while current trading volume is subtracted from the previous OBV when the current trading volume is low.The OBV Indicator helps a trader to make informed decision in whether to enter the market or to exit the market,this is because it helps to trader to understand the trends and the price direction earlier even before the price changes.
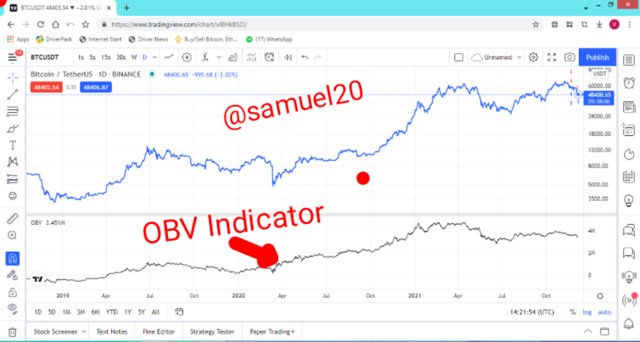
Since the OBV is volume dependent,it means that when the buying volume is very high,it will indicate a bullish trend(buying position). and when the selling volume is low,it will indicate a downtrend(selling position).

Using any charting platform of choice, add On-Balance Volume on the crypto chart. (Screenshots required).
I have defined the OBV indicator earlier on.It has a lot of benefit to traders.However,before you can enjoy the benefits,you have to add it to your chart.This time,I want to demonstrate how to add it to a chart.I am using Tradingview as a case study.
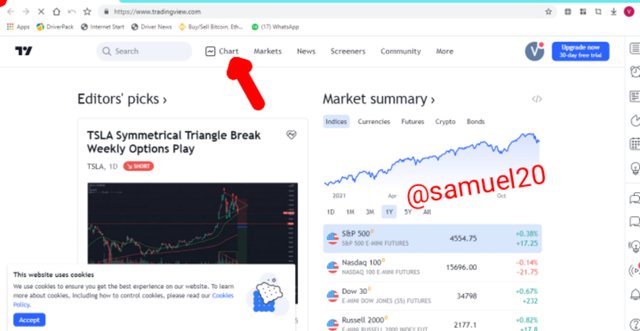
•Visit tradingview.com

•Click on Chart
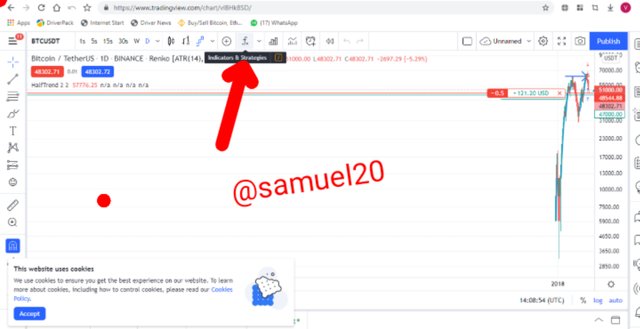
•Now select 'indicators and strategies
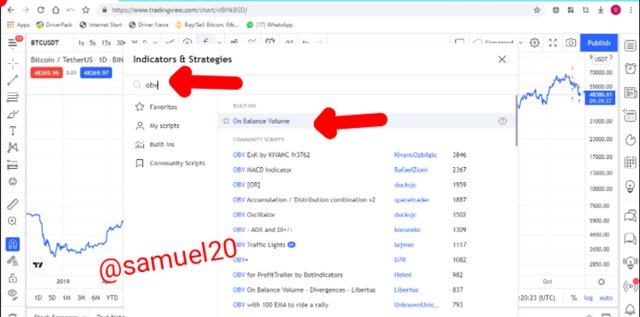
•In the search box enter OBV and select On-Balance volume for the list
•Now you can see the OBV Indicator.I hovered my mouse around it and click on Setting.On the settings,I clicked on Style and.changed the colour of the Indicator line from blue to black.
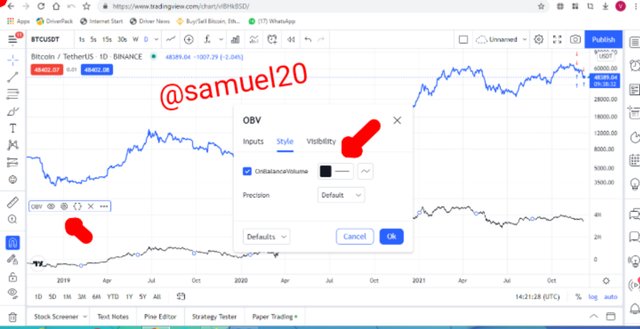
•Congratulations to me.I have successfully added OBV indicator to a chart on tradingview.


What are the Formulas and Rules for calculating On-Balance Indicator? Give an illustrative example.
Just like some other Indicators.OBV has its own formula.The formula can involve addition or subtraction depending on the value of the previous volume of OBV and the current OBV volume.
a.)When current price is higher than the previous close.
OBV= Previous OBV + Current volume
b.)When the current price equals the previous day's close.
OBV=Previous OBV + 0
c.)When the current price is less than the previous close.
OBV=Previous OBV - Current volume
Problems
Calculate the value of the OBV in the following market situation.
a.)The current volume stands at 25 when the previous volume is 15
b.)The current volume is 30 and the previous volume is 40
c.)The current volume is 40 and the previous volume is 40
Solution
OBV= Previous volume + current price
OBV=15 + 25=40(uptrend)
b.)Since the previous volume is higher than the current price.
OBV=Previous volume - current price
OBV=40 - 30= 10(downtrend)
c.)Since the previous volume equals the current price
OBV=Previous volume + 0
OBV=40 + 0=40

What is Trend Confirmation using On-Balance Volume Indicator? Show it on the crypto charts in both bullish and bearish directions. (Screenshots required).
In the crypto chart.When the buying pressure is high,the price will increase and so it is regarded as an uptrend which is a good time to buy.Also when the selling pressure is high,the price will decrease and so it is regarded as a downtrend which is a good time to sell.However,the use of indicators like OBV helps to confirm when there is an uptrend or a downtrend.
Trend confirmation using OBV Indicator simply means to confirm the existence of an uptrend (bullish market) or a downtrend(bearish market) by looking at the direction and movement of the OBV Indicator line (black line).
•Confirmation of Uptrend Using OBV Indicator
When the prices continues to move up due to high buying pressure.It is seen as an Uptrend and the market is said to be bullish.
When the OBV line(black line) shows higher highs at the top and higher lows at the bottom.Then it is a confirmation of an Uptrend and a bullish market.
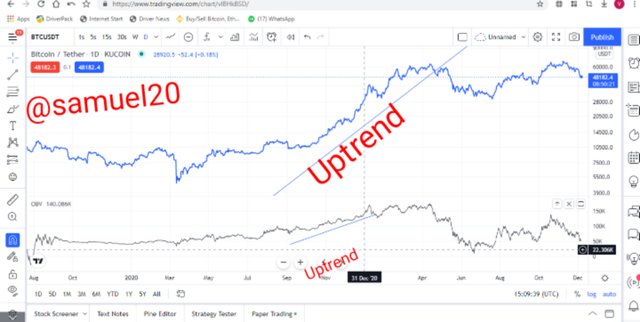
From the BTCUSDT chart above,you will notice that the highs are getting higher (higher high) and the low is also getting higher (higher lows).This confirms an uptrend.Notice that the price of the asset (in blue line) is also going up.This is a confirmation of uptrend.
•Confirmation of Downtrend Using OBV Indicator
When the prices continues to move down due to high selling pressure.It is seen as a downtrend and the market is said to be bearish.
When the OBV line(black line) shows lower highs at the top and lower lows at the bottom.Then it is a confirmation of a downtrend and a bearish market.
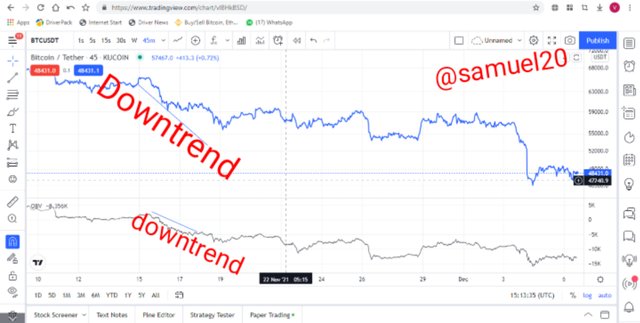
From the BTCUSDT chart above,you will notice that the lows are getting lower (lower lows) and the high is also getting lower (lower highs).This confirms a downtrend.Notice that the price of the asset (in blue line) is also going down.This is a confirmation of downtrend.

What's your understanding of Breakout Confirmation with On-Balance Volume Indicator? Show it on crypto charts, both bullish and bearish breakouts (Screenshots required).
In a crypto chart.There is a support and a resistance level.A good trader draws his resistance and support level.The resistance level is the point where the price reaches before going down while the support is where the prices reaches before going up.Whenever the price moves above the resistance level and continues to go up,it means that a breakout has occured.Also when the prices crosses the support level and continued going down,it means that there is a breakout.
OBV Indicator is used to confirm breakout when the resistance or support level is exceeded either is a bull market ( resistance level is exceeded/broken) or bear market(support level is exceeded/broken).
•Bullish Breakout Confirmation
This is when there OBV Indicator line crosses the resistance level and continues to go up instead of going down.This will then lead to an uptrend because the price has broken the resistance level.
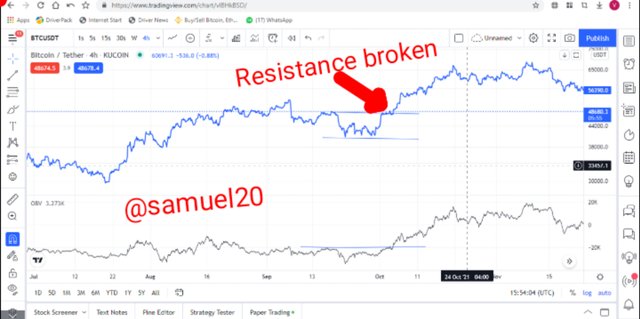
From the chart above,you can see that the price had broken the resistance level leading to an uptrend (bullish breakout).This action was also confirmed on the OBV indicator.
•Bearish Breakout Confirmation
This is when the OBV Indicator line crosses the support level and continues to go down instead of going up.This will then lead to a downtrend because the price has broken the support level.
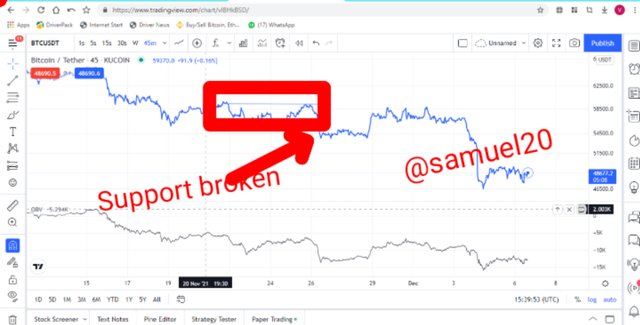
From the chart above,you can see that the price had broken the support level leading to a downtrend (bullish breakout).This action was also confirmed on the OBV indicator.

Explain Advanced Breakout with On-Balance Volume Indicator. Show it on crypto charts for both bullish and bearish. (Screenshots required).
Breakout is a break away from the support or resistance level.Advanced breakout simply means when the breakout occurs on the OBV Indicator before it now happens on the price of the assets.The presence of the advanced breakout on the OBV will make trader to predict the price movement.
•Bullish Advanced Breakout
This is when the price of the asset fails to reach the previous high price but the OBV has broken above its previous high price and continued to move higher(uptrend).This scenero will help a trader to know that the uptrend will continue since the OBV had already broken its previous high.
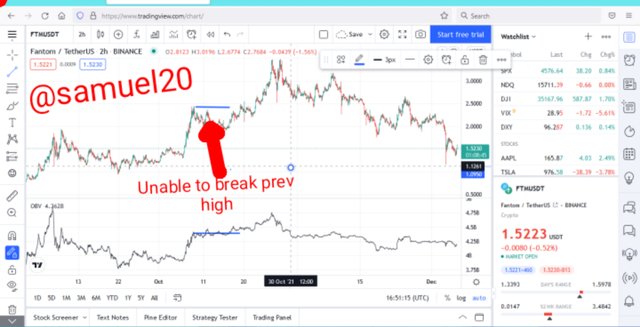
From the chart above,the price has refused to move above the previous high while the OBV had already broken above the previous high.After that an uptrend occured which is a confirmation of the advanced breakout shown by the OBV Indicator.
Bearish Advanced Breakout
This is when the price fails to reach the previous low price of the asset but the OBV has broken above its previous low price and continued to move down(downtrend).This scenero will help a trader to know that the downtrend will continue since the OBV had already broken its previous low.
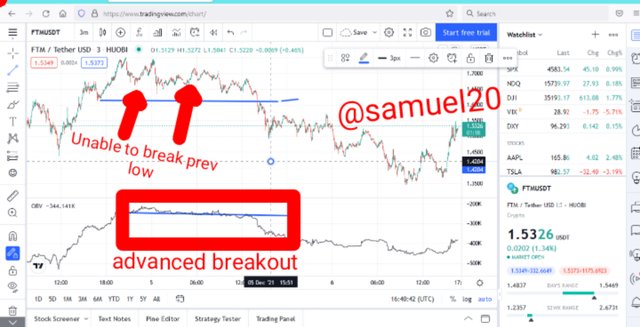
From the chart above,the price has refused to move below the previous high while the OBV had already broken below the previous low.After that a downtrend occured which is a confirmation of the advanced breakout shown by the OBV Indicator.

Explain Bullish Divergence and Bearish Divergence with On-Balance Volume Indicator. Show both on charts. (Screenshots required).
Bullish divergence is a situation where the price of an asset has continued to go down but the OBV indicator line is going up.As the OBV is going up,it means that the bearish session shown by the price line will soon be over and so the trader to prepare for a buy position.This situation is called bullish divergence because the indicator is pointing towards the bull(uptrend).
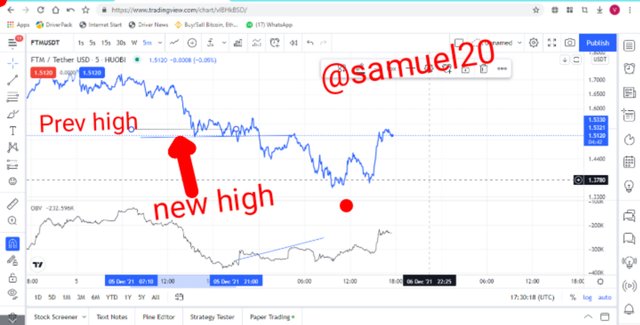
From the chart above,the OBV Indicator is showing uptrend while the price is showing downtrend although the price later moved up to confirm bullish divergence.
Bearish divergence is a situation where the price of an asset has continued to go up(new high is greater than previous high) but the OBV indicator line is going down.As the OBV is going down,it means that the bullish session shown by the price line will soon be over and so the trader to prepare for a sell position.This situation is called bearish divergence because the indicator is pointing towards the bear(downtrend).

Confirm a clear trend using the OBV indicator and combine another indicator of choice with it. Use the market structure to place at least two trades (one buy and one sell) through a demo account with proper trade management. (Screenshots required).
Buy Trade
Now I want to confirm an uptrend with the combination of OBV and Aroon indicator .The OBV showed a higher high and a higher low.Then the Aroon-up (orange line) has crossed the Aroon-down(blue line) which indicates an uptrend.
With this two indicators,I have confirmed an uptrend which is a buy position.
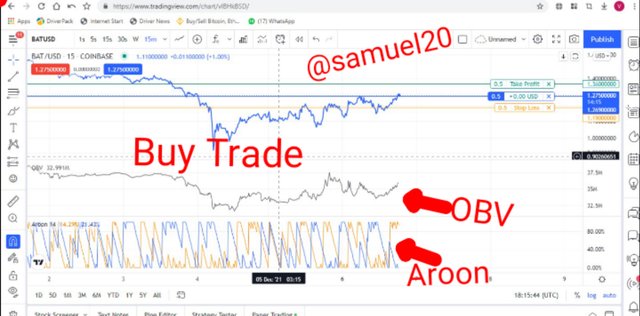
I confirmed this and used it to perform a buy trade in the BATUSDT pair whose current price is $1.275 where I set the take profit at $1.36 and the stop loss at $1.19.
Sell Trade
Now I want to confirm an downtrend with the combination of OBV and Aroon Indicator.The OBV showed a lower low and a lower high.Then the Aroon-down(blue line) has crossed the Aroon-up(orange line) which indicates a downtrend.
With this two indicators,I have confirmed a downtrend which is a sell position.
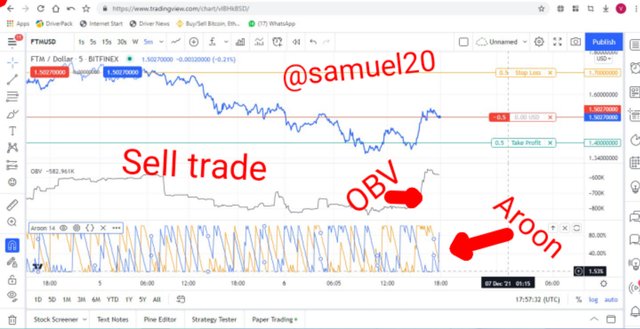
I confirmed this and used it to perform a sell trade in the FTMUSDT pair whose current price is $1.5027 where I set the take profit at $1.400 and the stop loss at $1.700.

What are the advantages and disadvantages of On-Balance Volume Indicator?
Advantages of OBV Indicator
•It is used to confirm the presence of a trend:With the help of an OBV Indicator,a trader can easily notice the presence of an uptrend or a downtrend.When the Indicator shows higher highs and higher lows,the an uptrend is taking place.When the OBV Indicator shows lower highs and lows lows,the an uptrend is taking place.
•
•Breakout Confirmation
Sometimes the price of an asset breaks the resistance or support levels.This scenerio isosr times confirmed with the OBV Indicator.
•Presence of Divergence
A bearish or bullish divergence can easily be spotted using OBV Indicator.When the price of an asset is going up and the OBV is going down,it means a bearish divergence.Also when the price of an asset is going down and OBV is going up,it means a bullish divergence.
•Since its reading is based on volume.So it is easy to understand presence of buy pressure and sell pressure.

Disadvantages of OBV Indicator
•It can give wrong information sometimes due to delayed volume confirmation.
•It requires combination with other Indicators to confirm a trend.
•Short time intervals are not properly represented using OBV.

Conclusion
Indicators are important technical tools.OBV Indicator is one of the best indicator used by traders to predict the future price of an asset.It is used to confirm an uptrend and downtrend.This indicator helps a trader to know when to enter a market and when to exit the market.It is important to combine the OBV Indicators so as to confirm any trend and break out.