![Screenshot_20211001-124120[1].png](https://steemitimages.com/640x0/https://cdn.steemitimages.com/DQmUX42ULYwGRmUqEDkZvco5MPn18NCh4jCxiMX6zuiwqHA/Screenshot_20211001-124120[1].png)

Explain Leading and Lagging indicators in detail. Also, give examples of each of them.
Leading Indicators are tools that provide information on market trends before it emerges. Simply put, leading Indicators evaluate the strength or weakness of the market trend in advance.
Leading Indicators are faster than price as they provide signals before the occurrence of trends. This can be preferred by most traders, I mean who does not like to have first hand an information before jumping into anything. They are said to be suitable for short-term analysis.
The indicators shows trend reversal before it happens on the chart. However, leading indicators frequently show misleading signals as they are not always accurate.
Some examples of leading Indicators include: Relative Strength Index(RSI) and the Stochastic RSI, in some way the candlesticks might also be considered a type of leading indicator this is due to the patterns the create.
In contrast to leading Indicators, Lagging Indicators just like the name implies is "behind". The move behind the trend, lagging indicators are slower than price. They are used to identify already existing trends which may or may not be evident on its own.
Lagging Indicators give traders an insight to what has already happened, however, they are relevant to spotting the very beginning of new market trends.
Let's use the moving Average as an example. In moving average, if price drops below the moving average, this could indicate the start of a downtrend and if price is above it is in uptrend.
Unlike leading indicators, lagging indicators are more reliable because they are defined by previous market data. They only obvious downside is delayed reaction to market movements, these signals can come really late and can make a trader miss a favorable position which would result in potential lower gains or looses. Lagging indicators are applied for long-term analysis.
Some examples of lagging Indicators are: Moving Average, EMA, MACD, Parabolic SAR etc.

With relevant screenshots from your chart, give a technical explanation of the market reaction on any of the examples given in question 1a. Do this for both leading and lagging indicators.
Using the Stochastic RSI as a leading indicator.
.png)
From the chart above, The Stoch RSI has shown a bullish impulse and is currently close to the overbought region.
Using The Moving Average Exponential (EMA) as the lagging indicator
.png)
EMA exponential (50 period), shows price is about to make a golden cross, if that happens and the current candle closes above the 50 exponential EMA, then it shows more confirmation that price is indeed bullish.

What are the factors to consider when using an indicator?
One can simply say Indicators, are weapons of choice. In this case tools of choice by which traders that which best fit their unique styles and learn to master it. Everyone with their preference, some traders would like to view the market momentum, some want to filter market noise , while some to measure volatility.
Here are some factors to consider when using technical indicators.
Understanding the sole purpose: Firstly, you need to understand that technical Indicators are essential tool used for confirmations only. And as such is not the basis of analysis. Do not use as a standalone tool.
Market Trends:You need to understand the market trend. Understanding the market trend would give you an insight on what indicators to best use. Now considering the volatility of the market, it can either be trending or ranging or momentum. This would give a better understanding on what indicator to use, if it would be a trend-based indicator , ranging indicator, momentum Indicator, volume Indicator and volatility Indicator.
Best desired trading strategy: You will need to understand the historic data and the price action .The best indicator needed for your trading decisions, this is just as we have been discussing either the leading or lagging indicator. So you can know when to get favorable positions.
Technical Analysis confluences: Combined use of different technical indicators or multiple trading signals to confirm the validity of potential buy or sell signal. Confirmation of market trend or price reversal level can be done using multiple data and trading signals.

Explain confluence in cryptocurrency trading. Pick a cryptocurrency pair of your choice and analyze the crypto pair using a confluence of any technical indicator and other technical analysis tools. (Screenshot of your chart is required ).
Confluence like the word is used to describe where two points meet to become one. In cryptocurrency trading is all about confirming a trade with two or more indicators. For a trader to be absolutely sure of executing a trade, would have to wait for at least 2 or 3 indicators to all conclude at the same price bias before executing a buy or sell trade.

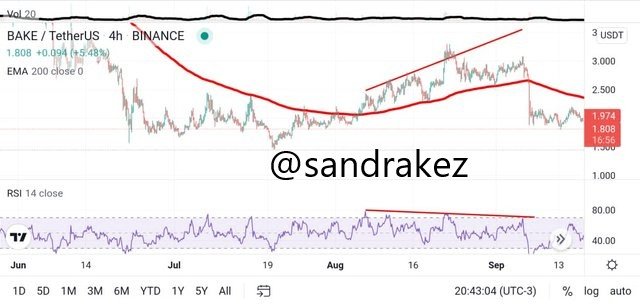
Here is a confluence of bearish divergence, descending RSI and a golden cross on 200EMA. I have combined two indicators the Relative Strength Index(RSI) and the Moving Average Exponential(EMA) and have confirmed it is indeed a Bearish divergence.

Explain how you can filter false signals from an indicator
A false signal could be spotted using both the leading and lagging indicator. However using the lagging indicator as your news and the leading indicator as speculation and confirmation, combined together can help tell you what is really going on.
When the price does not move in the same direction as the indicator, this is said to be a false signal. To filter this false signal a good way would be to always ensure that the price action is in confluence with the indicator signal. And also that more than one technical indicator are in confluence.
Another way could be said to divergences, which we would be looking into right away.

Explain your understanding of divergences and how they can help in making a good trading decision.
Divergences occurs when that the price moves in an opposite direction from the indicator. Divergences are used by traders to determine if the market trend is getting weaker, which would most likely lead to a trend reversal.
A good example is the RSI indicator. The Relative Strength Index can be used to search for divergences between the RSI and the price of an asset.
This can be positive or negative, in the sense that a positive divergence may occur when there is a decrease in price and the indicator is suggesting an increase in buyers. This can be considered a bullish divergence which may be followed by a price reversal to the upside. While, negative divergence may occur when price is increasing and the indicator suggests a decrease in buy.
For traders divergences can help to determine entry and exit points also their stop losses. However, divergences are not always visible and as such should not be solely relied on as they can also produce false signals.
Using relevant screenshots and an indicator of your choice, explain bullish and bearish divergences on any cryptocurrency pair.

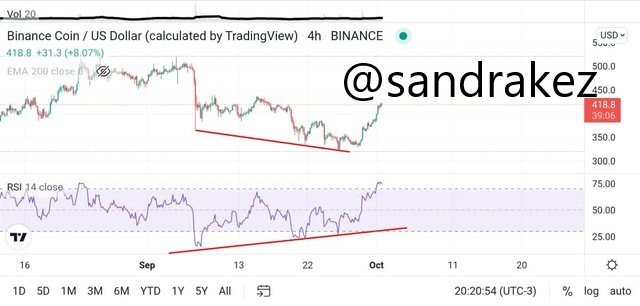
The chart above shows a Bullish Divergence, there is an uptrend by formation of low high while the uptrend is signaling a downtrend by the formation of a lower low. The downtrend is almost over and a possible reversal. This is a positive divergence

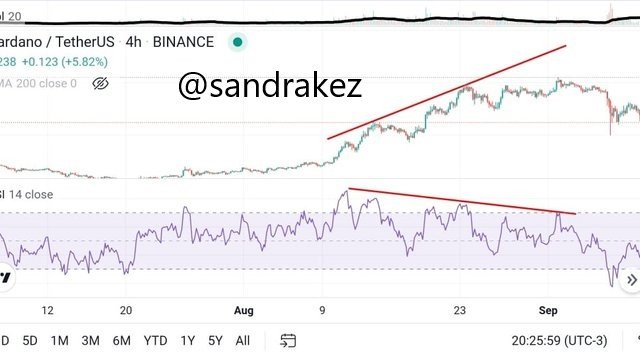
The chart above is a Bearish diveregence of CARDANO/USD of the RSI indicator. The bearish occurs when the indicator makes a lower low formation and on the other hand price a higher high.

Conclusion
The leading and lagging indicators play a very important role in technical analysis. These indicators predict future trend or confirm already happening trends. We have also discussed divergences and how to filter false signals.
Thank you @reminiscence01 for another interesting lecture.
Hello @sandrakez, I’m glad you participated in the 4th week Season 4 of the Beginner’s class at the Steemit Crypto Academy. Your grades in this task are as follows:
Recommendation / Feedback:
Thank you for participating in this homework task.
Downvoting a post can decrease pending rewards and make it less visible. Common reasons:
Submit
Thank you prof. No offense, I was just wondering why I got a 7.5 even with your positive Feedback?
Downvoting a post can decrease pending rewards and make it less visible. Common reasons:
Submit