Edited on Canva
Hello Everyone,
First, I would like to congratulate professor @reddileep for the first lecture. I went through the lecture and feel it’s an interesting topic, and now I’m going to submit this task.

1-Define Heikin-Ashi Technique in your own words.
Heikin-Ashi is a quantifiable tool that forms a graphical representation of market price. That can be can be managed based on the High, Low, closing, and opening price of the previous candle to make a prediction or future chart form. Heikin-Ashi trading comes from a Japanese trading indicator which means an average- bar, like a candlestick chart and that gives more analytical and more precise. That can be seen from naked eyes. This can be drawn based on the taking average value of the previous candle prices in the form of Closing, opening, high and low-price data.
By using the Heikin-Ashi technique can help traders for identifying the market trends downtrends or uptrends or other patterns like reversal patterns. It creates more quantification and precise chart compare to traditional candlesticks chart, the reason is that it uses the previous candle data to make the correct chart and gives traders more confidence for their assets. The Heikin-Ashi use time series techniques to draw the Opening, closing, high, and low candle chart.

2-Make your own research and differentiate between the traditional candlestick chart and the Heikin-Ashi chart. (Screenshots required from both chart patterns)
These are the main differences between the traditional candlestick chart and the Heikin Ashi chart.
| Heikin-Ashi | Traditional candlestick |
|---|---|
| The graph is quantifiable and more precise. | The graph is imperceptible and inaccurate. |
| Easy to identify the uptrend and downtrends. | Hard to identify the trends |
| It forms the chart based on closing, opening, high and low price data. | It forms based on time frame data and other calculations. |
| In this Candlestick which starts from the middle of the previous candle | Whereas every candle starts by the closing of the previous candle |
| Its simple concept color changes only on trends change. | It’s a mixed color and did of the exact market trends |

3-Explain the Heikin-Ashi Formula. (In addition to simply stating the formula, you should provide a clear explanation about the calculation)
As we have already seen (Close, Open, high, and low) price Heikin-Ashi parameters let’s see the formula.
Close price:
For calculating of close price these mathematical applied. That gives the average of the current bar.
Formula:
Close=1 /4(Open+High+Low+Close)
Let’s understand by an example suppose the close, open, high, and low price is $4.5,$6.5, 8, 10 respectively and the Heikin-Ashi close price will be $7.25
Close price=$(4.5+6.5+8+10)/4
=29/4
Close price =$7.25 (average of current bar)
Open Price:
For calculating of open price these mathematical applied. That gives the mid of the current bar.
Formula:
Close=1 /2(Open of previous bar + close of the previous bar)
Let’s understand by an example suppose the open previous and close previous, are $20,$30 respectively and the Heikin-Ashi open price will be $25
Open price=$(20+30)/2
=50/2
Open price =$25 (Midpoint of current bar)
High:
For getting the high price of Heikin-Ashi uses the Highest price, Open price, Clos price.
Formula:
High = Max (Highest price, Close, Open)
Let’s understand by an example suppose the Highest price, close price, and Open price are $45,$30,25 respectively and the Heikin-Ashi open price will be $45.
High = Max (45, 30, 25)
High=$45
Low:
For getting the low price of Heikin-Ashi uses the lowest price, Open price, Close price.
Formula:
Low = Min (Open, Close, Lowest) price
Let’s understand by an example suppose the lowest price, close price, and Open price are $23,$35,39 respectively and the Heikin-Ashi open price will be $23
Low = Min (23, 35, 39)
Low =$23

4-Graphically explain trends and buying opportunities through Heikin-Ashi Candles. (Screenshots required)
Heikin-Ashi is very simple to identify the trends and based on that traders can take strong decisions. Basically, Heikin-Ashi forms a quantifiable representation of the price market and plot the chart.
Normally uptrends from strong plot green bars of strong bullish trends with excessive shadows or wicks underscore on an upper candle. Likely downtrends form the red bar of a strong bearish candle. With excessive lower shadows in the lower candles.
Buying Opportunity with Heikin-Ashi
As we already talk about trends so usually uptrends or bullish trends that is a great opportunity for any trader. By using Heikin-Ashi crates in uptrends after indecision sign in price movement. Let’s see below BNB/USD chart.
In this screenshot, we can see the BNB/USD chart that is generated using a strong bullish candle in green color or bullish reversal pattern. So, the right buying opportunity can be seen after in indecision sign (marked in rectangle box in the image). Which is in uptrends.

5-Is it possible to transact only with signals received using the Heikin-Ashi Technique? Explain the reasons for your answer.
I would say No, there are many reasons for that. Actually, it’s not useful for shorter time frames like intraday trading which is normally for 15 minutes or less than that. Due to it take the average price of two periods. Apart from that it shows slow market trends and does not provide reversals pattern to traders. As Heikin-Ashi forms a smooth candle bar and does not show the gaps. It also does not help and predict the price movement which bothers traders.

6-By using a Demo account, perform both Buy and Sell orders using Heikin-Ashi+ 55 EMA+21 EMA.
Buy Trade
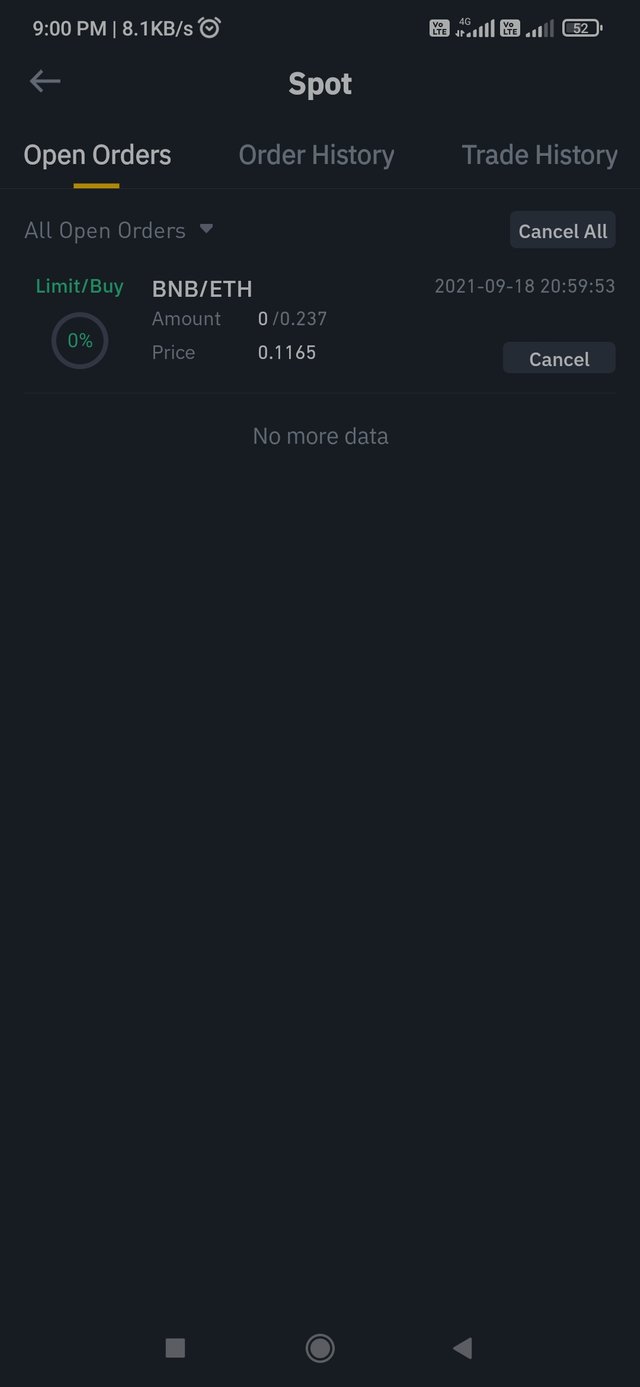
BNBETH
In the above screenshot, we can see the indecisive movement obscured before candle price data forms uptrends. And the 21 EMA has slightly crossed above the 55 EMA that is buying signal for traders and As in Heikin-Ashi uptrends or bullish trends for buyers. And The risk rewards ratio I kept 1:3 where the stop loss is 1 and take profit is 3.

Sell Trade
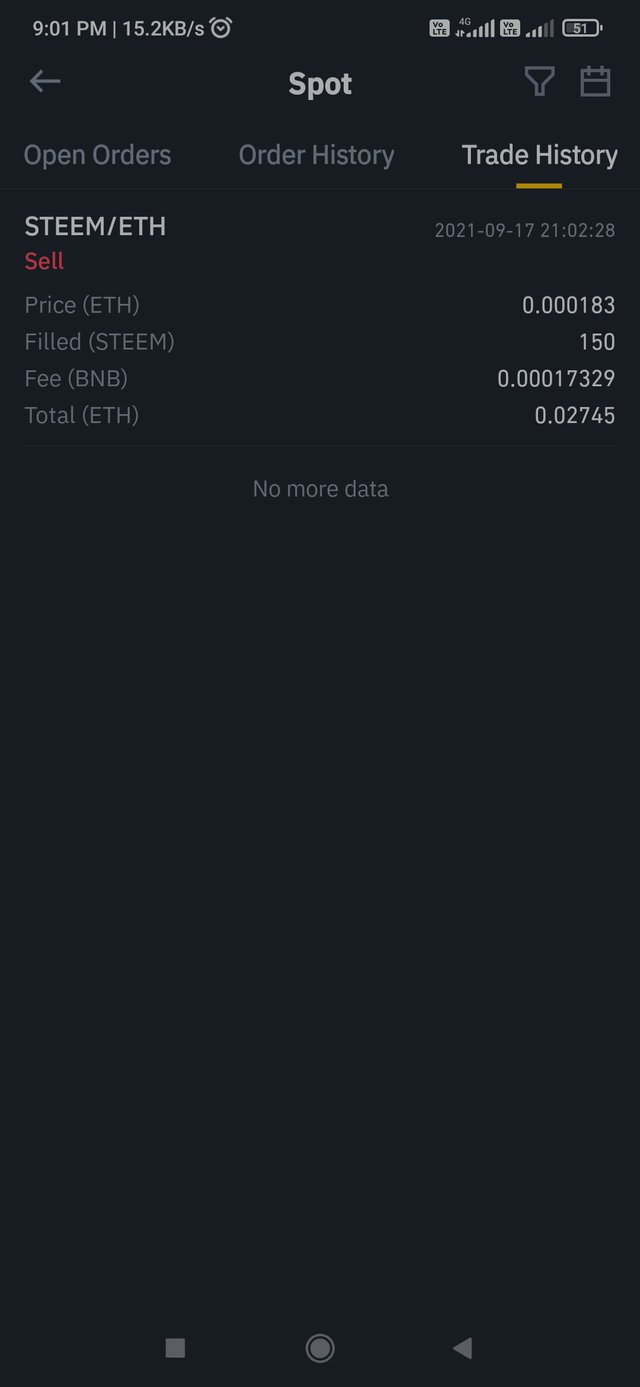
STEEM/ETH
As we can see in the above screenshot of STEEM/ETH price chart. indecisive movement obscured followed by a bearish candle. And the risk-reward ratio is 1:2.


Conclusion
Heikin–Ashi forms a smooth and simple price candle chart. And help traders to take strong devious before investing. As with other techniques, it has its own profit and cons. So very important to understand the Heikin–Ashi technique and then apply it. Once again, I would like to thanks professor @reddileep for this wonderful class.
Note: All the screenshot taken from Tradingview


