Crypto Analysis #3
Ethereum Vs US Dollar
Hey there, TraderSaan is here.
Today I am going to share my analysis and setup in the ETHUSD. I am actually a swing trader, meaning I hold my position for 2-3 days or more. So I usually trade at the timframe of 4 hour (H4), 1 hour(H1), or occasionally at 30 miniutes (M30). And one more thing is that I analyze the chart in tradingview and take trade in MT4.
Firstly, I will cover the fundamental analysis and then give an insight of technical part.
Fundamental Outlook(Bullish)
• Russia was banned from dealing using neighbour country's currency after the fast sanction of Joe Biden and NATO. After that, Russia is completely unable to deal with some major country. So in order to continue their business transaction, they could go for using ETH as a payment currency as ETH is one of the most major cryptocurrency till now.
Sanction on Russia is the cause of appreciating Cryptocurrency.
• We all are aware of the metaverse world. To be straight forward, Metaverse is our future. So Crypto currencies are going to be appreciated with this sentiment.
Technical Outlook
As I am fundametally bullish in ETHUSD, so I will look for only BUY entry in the technical chart of this pair.
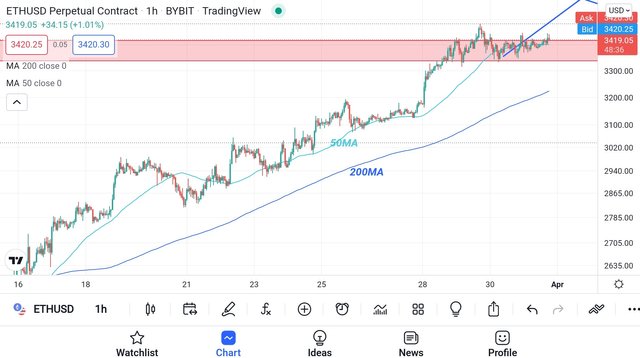
• So far price has been making an uptrend in 1 hour timeframe for fews days, making higher highs and higher lows, breaking resistance zone again and again. 50 MA and 200 MA are beautifully aligned upwardly which indicates a heavy momentum to the upside. Look, It didnt even touch 200MA for quite a while, meaning strong move to the upside.
ETCUSD, H1, 50&200MA are aligned upwardly

Image source: tradingview, prepared by me
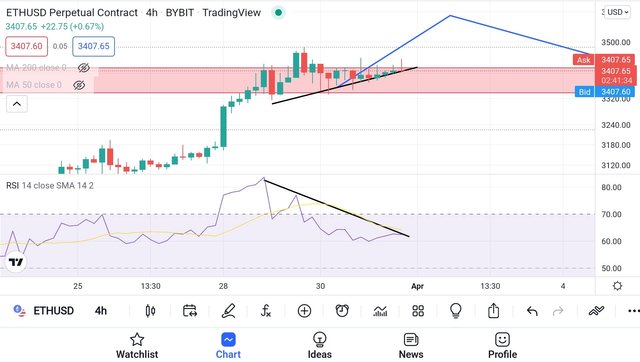
• On the other part of indicators, in RSI(Relative Strength Index), we see a divergence situation, i.e., When price goes upward, the RSI goes downward(it is shown in the chart by black coloured line). This is a very popular concept to take a gauge of market's next move. So in this scenario, price is likely to go up.
ETHUSD, H4, price is diverging from RSI

Image source: tradingview, prepared by me
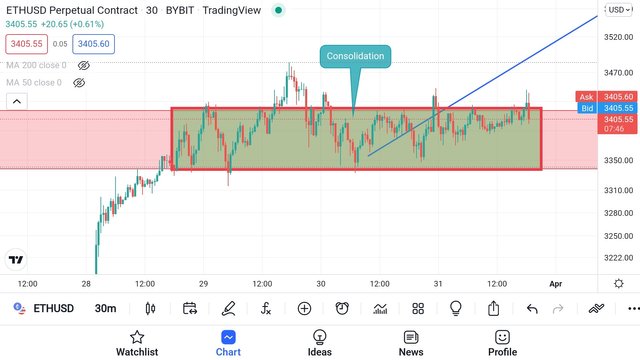
• Price is really consolidating in M30 in a H4 resistance zone which indicates that Buyers are still not giving up completely. That's why sellers are not able to push the price lower. And this consolidation has other confluences like RSI DIVERGENCE, 50MA support, so it's likely to have a breakout over there. The red bordered rectangle is the consolidation zone in the chart below.
ETHUSD, M30, a consolidation in resistance zone

Image source:tradingview, prepared by me
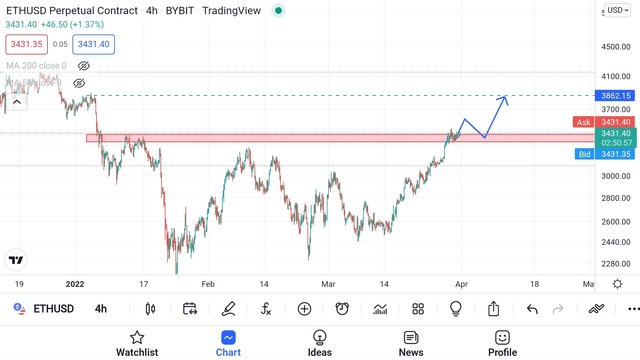
• So my take is that if price break the resistance zone, I will wait for a healthy pullback to the broken resistance zone. Then I will buy ETHUSD on the resistance level with a tight Stop Loss and with the expectation of a bigger move as Target Profit in 40k level or more which I have shown with a blue coloured arrow in the chart. I called this strategy BREAKOUT PULLBACK which I have discussed in details in my earlier post. Check the link out if you don't know yet.
https://steemit.com/hive-108451/@sanjibmondal99/4gw3fh-the-breakout-pullback-strategy-for-trading
ETHUSD, H4, waiting for a resistance breakout and pullback

Image source: tradingview, prepared by me
•Keyword: Paitence is the key•
I always take a trade when my fundamental and technical analysis say the same thing. As follows:
Case I
Fundamental = buy, Tchnical = sell, that implies Not To Trade
Case II
Fundamental =sell, Technical = buy, that implies Not To Trade
Case III
Fundamental = buy, Technical = buy, that implies Jump In For Buying
Case IV
Fundamental = sell, Technical = sell, that implies Jump In For Selling
Disclaimer: This is not any financial advise or trading mantra. My purpose is to help traders to learn. This post is made for completely educational purpose. Hope it helps.
Thank you very much if you make it to the end. Happy trade.