Hey steemians,
In this post i will be submitting my homework task for professor @kouba01.


Q-1.Explain the Williams %R indicator by introducing how it is calculated, how it works? And what is the best setting? With justification for your choice.


Williams %R Indicator or Williams Percent Range-
Williams %R Indicator or Williams Percent Range is momentum and leading indicator or oscillator, it is called oscillator because the value of Williams %R oscillates between 0 and -100.
Leading indicator: Leading indicators are the indicators that tell us about the probable movements of the price in the market in future. Being a leading indicator Williams %R is used by many traders to trade via technical analysis so that traders can take an early entry and ride with the trend and make a profit.
Momentum indicator: Momentum indicators tell us about the rate at which the price is fluctuating in the market by comparing the current price and the price values of the period set in the indicator.
Being a momentum as well as a leading indicator Williams %R becomes a very useful tool, indicator or oscillator that helps to find entry and exit signals at the early stage of the trend. Williams %R indicator also helps in spotting the accumulation(leads to an uptrend) and distribution(leads to a downtrend) phase, these phases lead to a reverse in the trend.
The comparison of the past values of the period set in the indicator to the present values makes Williams %R able to spot the potential reversals in the market and thus providing traders with buy and sell signals or entry and exit points.

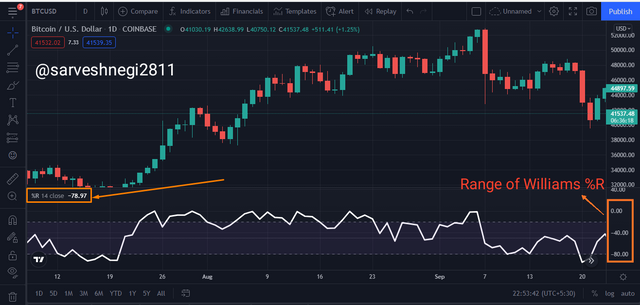

Larry Williams is the one behind the idea of the Williams %R indicator, he developed and published the Williams %R indicator completely in 1979 in his book called "How I Made $1,000,000 Trading Commodities Last Year."
Fun fact: In Larry Williams' book the multiplication of the formula was with the 100 instead of -100, may be it was a typo that we see nowadays which made the value of Williams %R oscillator oscillates from 0 to -100 instead of 0 to 100.
Calculation of Williams %R indicator is easy when compared to ADX.
So the formula for calculating William %R is:
Where,
Highest high: The highest price of the asset in the previous n periods.
Closing price: The recent closing price of the asset.
Lowest low: The lowest price of the asset in the previous n periods.
Note: "n" refers to the number of periods selected by an individual for the Williams %R indicator, it may vary with the traders as well as the trading style.
Now to understand it more clearly, I will be taking an example.
For instance, the highest value of ADA for the last 14 periods is $3, the most recent closing price is $2.7 and the lowest value of ADA in the last 14 periods is $2.1, now I will be calculating Williams %R for this example.
Williams %R: (Highest high - Closing price)/(Highest high - Lowest low) × (-100) [for last 14 periods]
Williams %R: ($3 - $2.7)/($3 - $2.1) × (-100)
Williams %R: ($0.3)/(0.9) × (-100)
Williams %R: (0.33) × (-100)
Williams %R: -33.33
Now a question might arise in your mind that how the value of Williams %R helps traders, so for that we have to understand two terms called Overbought and Oversold.
(1) Oversold: When Williams %R shows a value between -80 and -100 it is called oversold condition, when Williams %R value starts moving below from -20 towards -80, a downtrend can be seen. When Williams %R crosses -80 and reaches between -80 and -100, the price can be said to be very far from the highest price of the period taken into consideration.
(2) Overbought: When Williams %R shows a value between -20 and 0, it is called an overbought condition, when Williams %R value starts moving above from -80 towards -20, an uptrend can be seen. When Williams %R crosses -20 and reaches between -20 and 0, the price can be said to be very near from the highest price of the period taken into consideration.
In the hypothetical example above, i get value of Williams %R equal to 33.33, which shows that it is near to the overbought zone and a slight uptrend can be seen in thr market.
The settings of an indicator vary with the traders as well as the trading style of the traders, so it is not possible to say that a particular setting is the best setting for an indicator. Some traders opt for settings other than default settings because they are getting good results from it.
The default setting or period of Williams %R indicator is set to focus on the last 14 periods, note that the period refers to the candle, so they can show data of the previous 14 days in case of the 1D period, 14 hours in case of 1hr period and so on.

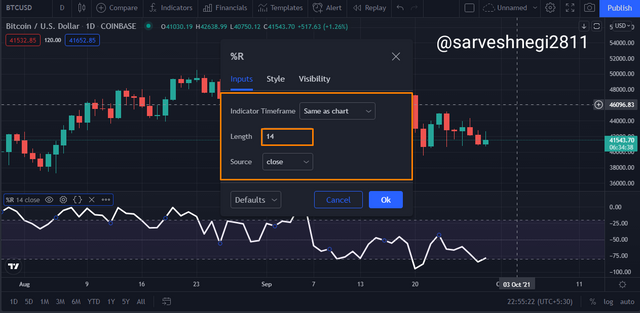

I will be talking about the different types or styles of trading and the probable best setting for those styles.
(a) Scalping trading: Scalping trading means trading for a very short period of few minutes and earning a little profit from each of the trades made. As scalping trading involves very less time we need the Williams %R indicator to be more sensitive or susceptible to any signals in the market.
So for scalp traders, the best setting could be a period of 5, as I have always stated that the less the period, the more the sensitivity or susceptibility of Williams %R indicator and the faster the signal will appear.
So using a shorter period can come in handy for scalp traders but it has its limitation and this limitation is the presence of false signals. Those false signals can be filtered using another indicator in conjunction with the Williams %R indicator.
(b) Intraday trader: It involves trading for a day and making a profit from a trade made on a day. As it doesn't involve less time for trading, we can go with the default settings of a period of 14 of Williams %R indicator as it will give signals early due to it being a leading indicator and the numbers of false signals will be less in comparison to less period or less time frame like in scalp trading.
(c) Long-term traders: This trading involves a period of 1 week to 1 year to gain a huge profit. As it doesn't involve less time for trading and requires a noise-free chart as well as the absence of false signals in the chart.
So for a long-term trader, a period of more than or equal to 20 will be appropriate or apposite, as I had stated earlier that the more the period, the less the false signals generated, so by using a period of 20 all the false signals will be filtered but it has also a limitation and that limitation is the lagging of Williams %R indicator in determining the momentum, it will result in late entry and exit points.
I have told you about the three trading styles and the probable best settings for these styles and you can see that for different trading styles, there is a different setting that can be considered as the best. So in a nutshell, the best settings of an indicator solely depend on the traders as well as the trading style of the traders.
Note: The developer or creator of the Williams %R indicator mentioned that the best period for an asset can be identified by calculating the dominant cycle of that asset and then divide the period of the dominant cycle by two, we get the period where we can get maximum success.

Q-2. How do you interpret overbought and oversold signals with The Williams %R when trading cryptocurrencies? (screenshot required)


There are two signals that generates whioe using Williams %R indicator and these two signals are:
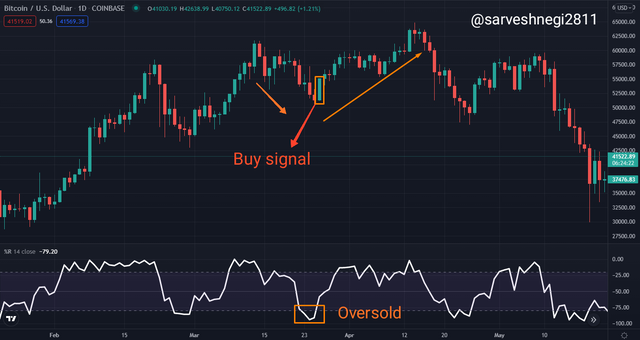
(A) Oversold: When Williams %R shows a value between -80 and -100 it is called oversold condition, when Williams %R value starts moving below from -20 towards -80, a downtrend can be seen. When Williams %R crosses -80 and reaches between -80 and -100, the price can be said to be very far from the highest price of the period taken into consideration.
An oversold signal appeared in the market when an asset has been relentlessly sold and lead to a decrease in the price of that asset but after that, a correction happened in the market via corrective waves that form in the opposite direction of the trend during the oversold signal.
At the time of correction in the market, a corrective wave is expected to appear to push the price in the upward direction again and that is what traders wait for, they can take an entry-level after confirming the correction in the market.
Note: An oversold signal doesn't need to always lead to a reversal in the trend and provide a buy signal, one must confirm the correction in the market and then enter accordingly. To be sure one can wait for the clear bullish candle and Williams %R showing a value above -50 or one can use EMA in conjunction to take entry.
In the example below you can see that Williams %R is showing a value below -80 and in between -80 to -100, which shows that the sellers are in control of the market or you can say Supply exceeds demand. After that a correction happened in the market and the value of Williams %R started moving upward towards -50 and a clear bullish candle appeared which can be an appropriate buy signal.


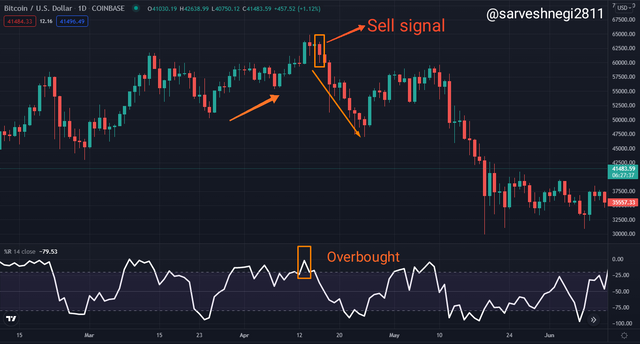
(B) Overbought: When Williams %R shows a value between -20 and 0, it is called an overbought condition, when Williams %R value starts moving above from -80 towards -20, an uptrend can be seen. When Williams %R crosses -20 and reaches between -20 and 0, the price can be said to be very near from the highest price of the period taken into consideration.
An overbought signal appeared in the market when an asset has been relentlessly bought and lead to an increase in the price of that asset but after that, a correction happened in the market via corrective waves that form in the opposite direction of the trend during the overbought signal.
At the time of correction in the market, a corrective wave is expected to appear to push the price in the downward direction again and that is what traders wait for, they can take an exit or consider it as a sell signal after confirming the correction in the market.
Note: An overbought signal doesn't need to always lead to a reversal in the trend and provide a sell signal, one must confirm the correction in the market and then exit accordingly. To be sure one can wait for the clear bearish candle and Williams %R showing a value below -50 or one can use EMA in conjunction to take an early exit.
In the example below you can see that Williams %R is showing a value above -20 and in between -20 to 0, which shows that the buyers are in control of the market or you can say demand exceeds supply. After that a correction happened in the market and the value of Williams %R started moving downward towards -50 and a clear bearish candle appeared which can be an appropriate sell signal.



Q-3. What are "failure swings" and how do you define it using The Williams %R? (screenshot required)


We talked about the overbought and oversold zones and what they reflect but what about when the Williams %R indicator started moving towards oversold or overbought zone but couldn't reach those levels, what would happen then??
To answer that we have a term called Failure swings, as the name suggests the failure swings are the swings in the Williams %R indicator that fail to reach the value of -80 to -100 in case of a bearish trend and -20 to 0 in case of a bullish trend.
Failure swings generate when the value of Williams %R isn't able to reach -80 in case of the bearish trend and -20 in case of a bullish trend. It occurs due to the weakness in the current trend or momentum.
Failure signals are very reliable signals that indicate a reversal in the market, failure signals can appear in both directions, upward and downward.
When Williams %R indicator fails to reach a value of -20 in an uptrend or bullish trend, a reversal is expected and the traders can use the failure signals in a bullish trend to get a sell signal.
When the Williams %R indicator fails to reach a value of -80 in a downtrend or bearish trend, a reversal is expected and the traders can use the failure signals in a bearish trend to get a buy signal.
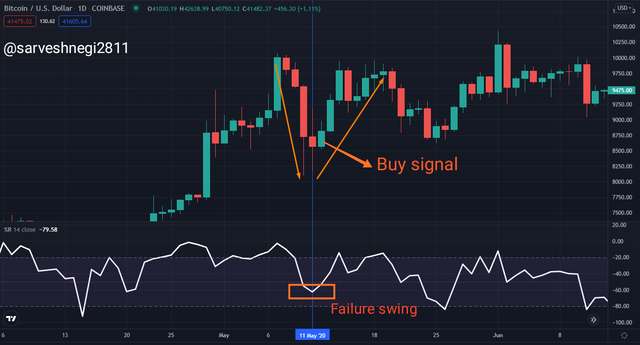
(a) Bullish reversal using failure swings: A bullish reversal can be seen when the value of the Williams %R indicator fails to reach -80 and the downtrend weakens resulting in a reversal in the upward direction.
In the example below, you can see that the value of the Williams %R indicator reached -60 but failed to reach -80, so a reversal was expected there and a reversal can be seen there with a buy signal from a clear bullish candle.


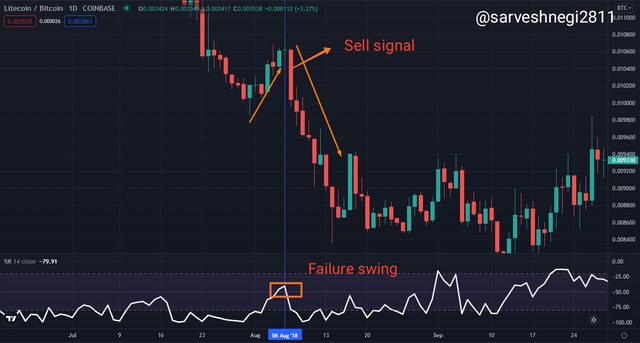
(b) Bearish reversal using failure swings: A bearish reversal can be seen when the value of the Williams %R indicator fails to reach -20 and the uptrend weakens resulting in a reversal in the downward direction.
In the example below, you can see that the value of the Williams %R indicator reached -40 but failed to reach -20, so a reversal was expected there and a reversal can be seen there with a sell signal from a clear bearish candle.



Q-4. How to use bearish and bullish divergence with the Williams %R indicator? What are its main conclusions? (screenshot required)


Divergence, as the name suggests, when something diverts from its original or expected path it is called divergence, but when it comes to trading there are two types of divergences:
(A) Bullish divergence
(B) Bearish divergence
Divergences can be considered as specific trends that generate in the Williams %R indicator, traders look for the divergences due to their ability to indicate a reversal in the price of an asset.
A bullish divergence reflects that the sellers in the market are losing control and the buyers are gaining control of the market-leading to an uptrend reversal or bullish reversal. This also provides traders with the buy signal.
A bearish divergence reflects that the buyers in the market are losing control and the sellers are gaining control of the market-leading to a downtrend reversal or bearish reversal. This also provides traders with the sell signal.
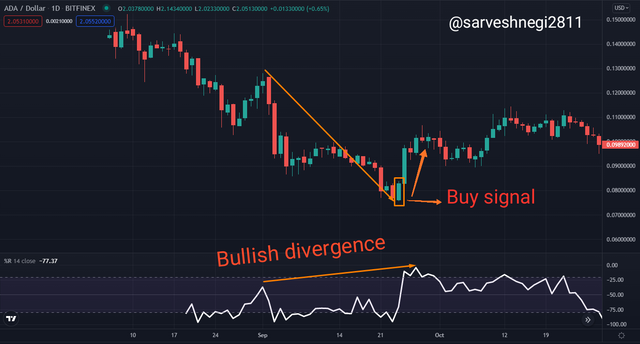
(A) Using Bullish divergence with Williams %R indicator: When we talk about Bullish divergence with Williams %R indicator, we are talking about a bullish or uptrend in the Williams %R indicator(means value going above towards -20) and at the same time the price must be going in a downward direction.
As I mentioned above a bullish divergence appears when the sellers are losing control in the market and a correction is going to happen along with the entry of buyers into the market.
When correction happens and buyers start to take control again in the market a reversal appears which can be identified easily using bullish divergence, traders can take advantage of bullish divergence and the bullish reversal and make an entry into the market. A clear green or bullish candle or EMA in conjunction with Williams %R indicator can provide a buy signal.
In the example below, you can see that the value of Williams %R is increasing or moving in an upward direction but at the same time the price of the ADA is falling, so we can say that it is a bullish divergence.
A reversal can be seen in the ADA chart which tells that sellers are losing control and a correction is going to happen, a clear bullish candle appeared which is an appropriate buy signal.


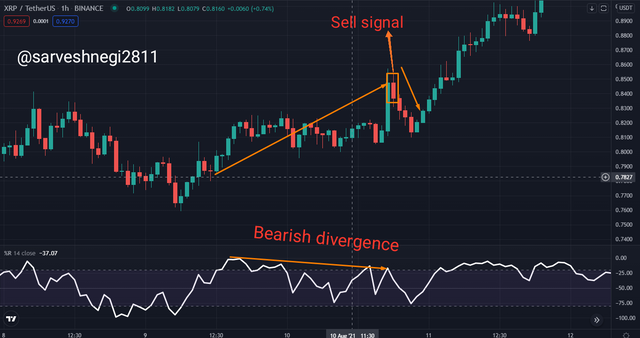
(B) Using Bearish divergence with Williams %R indicator: When we talk about Bearish divergence with Williams %R indicator, we are talking about a bearish or downtrend in the Williams %R indicator(means value going below towards -80) and at the same time the price must be going in an upward direction.
As I mentioned above a bearish divergence appears when the buyers are losing control in the market and a correction is going to happen along with the entry of sellers into the market.
When correction happens and sellers start to take control again in the market a reversal appears which can be identified easily using bearish divergence, traders can take advantage of bearish divergence and the bearish reversal and exit the market. A clear red or bearish candle or EMA in conjunction with Williams %R indicator can provide a sell signal.
In the example below, you can see that the value of Williams %R is decreasing or moving in a downward direction but at the same time the price of the XRP is rising, so we can say that it is a bearish divergence.
A reversal can be seen in the XRP chart which tells that buyers are losing control and a correction is going to happen, a clear bearish candle appeared which is an appropriate sell signal.


In conclusion, Bullish and bearish divergences are the trends that traders wait for and then accordingly enter and exit the market.
Traders identify the bullish divergence and get ready for a bullish reversal by making an entry at the point by taking a long position. Bullish divergence appears when sellers lose control and correction happens in the market.
Traders identify the bearish divergence and get ready for a bearish reversal by exiting at the point where a clear bearish candle appears. Bearish divergence appears when buyers lose control and correction happens in the market.

Q-5. How do you spot a trend using Williams %R? How are false signals filtered? (screenshot required)


Williams %R indicator is a versatile indicator as it provides various signals and information of an asset, and one of the information that it tells us is about the trend, a trend can easily be spotted using the Williams %R indicator.
We have talked about the danger levels at -20 and -80 but there is another important level and that level is -50, -50 being a middle value tells us about the momentum of the price in the market and thus help in identifying or spotting the trend, so -50 level is very important to take confirmation about the trend.
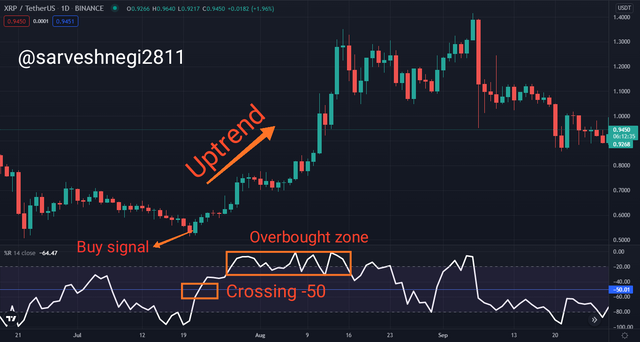
(a) Uptrend: Williams indicator can be used to spot an uptrend easily but there are some requirements and these requirements are:
(a1) Williams %R must come above from the oversold region or the region closed to oversold regions, like from the region valued "-70".
(a2) Williams %R must cross -50 level and go above it.
(a3) If the above two conditions get fulfilled we can see an uptrend and take a long position.


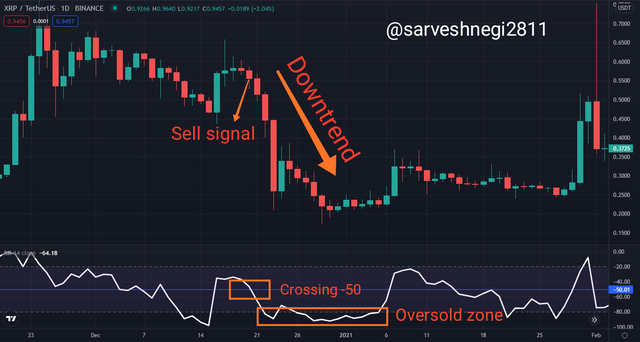
(b) Downtrend: Williams indicator can be used to spot a downtrend easily but there are some requirements and these requirements are:
(a1) Williams %R must come below from the overbought region or the region closed to overbought regions, like from the region valued "-30".
(a2) Williams %R must cross -50 level and go below it.
(a3) If the above two conditions get fulfilled we can see a downtrend and take a short position.


No matter how efficient and versatile an indicator is, it might provide some false signals because nothing is perfect. Some traders took those false signals seriously and suffer a huge loss or miss a profit of multiple folds.
So it is very important to use any other indicator in conjunction while the trading perspective of the primary indicator you are using. Now in the case of Williams %R indicator, we will be using EMA of length or period 14 in conjunction with Williams %R indicator.
EMA stands for the exponential moving average and it is also a technical indicator used by the traders as they act as the dynamic support and resistance and keeps track of the price.
Using EMA in conjunction with the Williams %R reduces the risk involved in trading. My previous homework task
As I mentioned above the EMA works as dynamic support and resistance for the price and the price respects the EMA by following dynamic supports and resistance created by EMA.
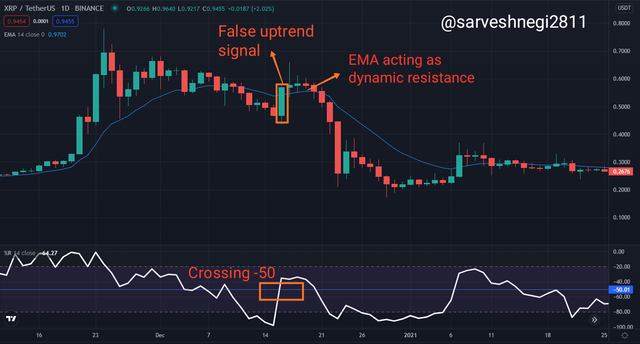
Now when a false signal is generated, EMA will tell us about it via the dynamic support and resistance.
In the image below you can see that the Williams %R indicator is fulfilling all the requirements that I stated for an uptrend and a green clear bullish candle generated indicating an uptrend and buy signal, but EMA that was acting as resistance is still acting as a resistance and no green clear candle appeared above EMA breaking dynamic resistance created by EMA.
So if a trader wouldn't use EMA in conjunction with the Williams %R, he/she would take that clear green candle as a buy signal and taking a long position which could suffer him/her a loss.


We can also use EMA in conjunction with Williams %R to confirm a signal as an EMA acts as dynamic support and resistance and price respects those levels.
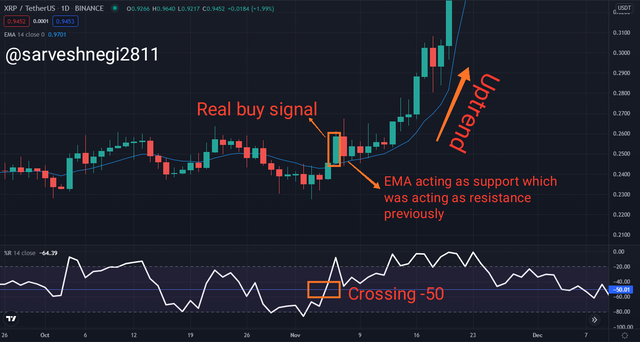
In the image below you can see that the Williams %R indicator is fulfilling all the requirements that I stated for an uptrend and a green clear bullish candle generated indicating an uptrend and buy signal.
EMA that was acting as a resistance level had been broken by a green candle and the green candle starts appearing above the EMA confirming that it is a true signal and an upward trend. EMA that was previously acting as resistance is now acting as support for the price.
You can see in the example below the breakdown of resistance by a green candle and EMA acting as support which was previously acting as resistance confirms an uptrend and gives a buy signal.



Q-6. Use the chart of any pair (eg STEEM/USDT) to present the various signals from the Williams %R indicator. (Screen capture required)


Being a momentum as well as a leading indicator, Williams %R provides the traders with various signals in the early stage of the trend and that is the reason why Williams %R when used in conjunction with EMA can provide traders with buy and sell signals at the very early stage of an uptrend or downtrend to give a chance to the traders to take a long and short position.
The Williams %R indicator is a very good Indicator to identify the trends, a reversal in the trend along with buy and sell signals. So some requirements must be fulfilled before entering into the market or marking a buy signal and these requirements are:
(A) We all know that an oversold signal leads to a reversal in the trend, so we must look out for an oversold zone, which means the value of the Williams %R indicator must be below -80.
(B) The value of Williams %R indicator must cross the -50 value and go above it to confirm an uptrend.
(C) We have to confirm an uptrend by using EMA which was previously acting as a resistance and now acting as a support level.
(D) If a clear green or bullish candle breaks the resistance level created by EMA, we can consider that as a buy signal and enter the market or take a long position.
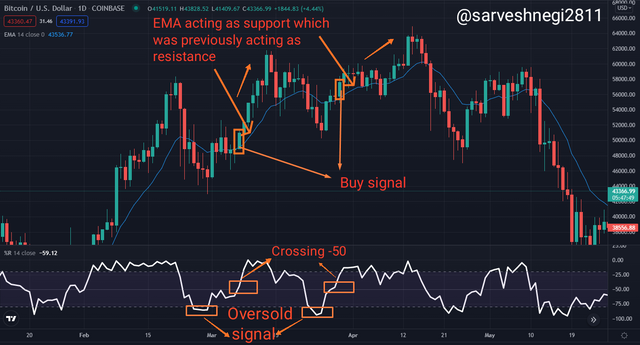
If all these requirements get fulfilled which includes the reversal from oversold signal, crossing -50 value confirming uptrend, and price breaking resistance created by EMA and EMA starts acting like a support, we can be sure about the buy signal and make a profit.
In the example below, you can see an oversold signal in the Williams %R indicator and then the value of Williams %R indicator moves above the mark of -50 confirming an uptrend. A clear bullish candle can be seen breaking the resistance created by the EMA which serves as the buy signal and an appropriate point for taking a long position. Following that, another oversold signal, a reversal in the trend, Williams %R indicator choosing -50 and price breaking resistance can be seen which can also be a buy signal and appropriate point for taking a long position.


The Williams %R indicator is a very good Indicator to identify the trends, a reversal in the trend along with buy and sell signals. So some requirements must be fulfilled before entering into the market or marking a sell signal and these requirements are:
(A) We all know that an overbought signal leads to a reversal in the trend, so we must look out for an overbought zone, which means the value of the Williams %R indicator must be above -20.
(B) The value of Williams %R indicator must cross the -50 value and go below it to confirm a downtrend.
(C) We have to confirm a downtrend by using EMA which was previously acting as a support and now acting as a resistance level.
(D) If a clear red or bearish candle breaks the support level created by EMA, we can consider that as a sell signal and exit the market or take a short position.
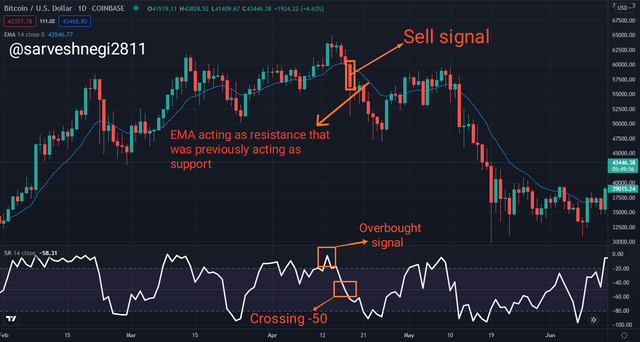
If all these requirements get fulfilled which includes the reversal from overbought signal, crossing -50 value and going below it confirming downtrend, and price breaking support created by EMA and EMA starts acting like a resistance, we can be sure about the sell signal or taking a short position.
In the example below, you can see an overbought signal in the Williams %R indicator and then the value of Williams %R indicator moves below the mark of -50 confirming a downtrend. A clear bearish candle can be seen breaking the support created by the EMA which serves as the sell signal and an appropriate point for taking a short position.


Placing trades that includes stop-loss and take profit levels using Williams %R and EMA:
Stop-loss and take profit levels are very important levels for traders as they help in reducing the loss made during a wrong trade and helps in gaining a maximum profit during a successful trade.
Position of stop-loss and take profit level in a buy signal or taking long long position:
(A) Stop-loss must be placed below the support created by the price.
(B) Take profit can be placed accordingly concerning stop-loss, it could be set in the ratio of 1:1, but we must set our reward ratio more than the risk ratio.
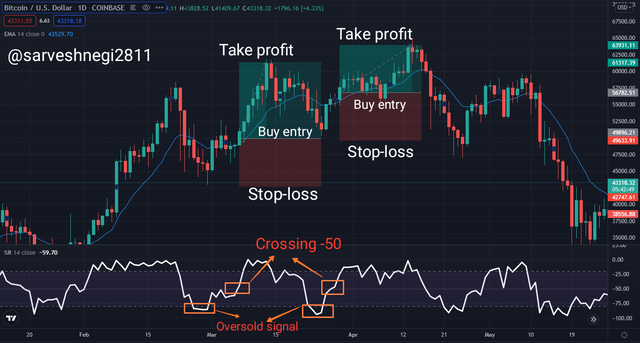
In the example below, you can see all the conditions of a buy signal or taking long position get fulfilled and I have placed my stop-loss at the support point created by the price for the previous 14 candles and placed my take profit level concerning stop-loss at the ratio of 1:2 risk-reward ratio.
Note: All the requirements for taking short and long positions are stated above, in this section i have only shown how and where to place stop-loss and take profit level


Position of stop-loss and take profit level in a sell signal or short position:
(A) Stop-loss must be placed above the resistance created by the price.
(B) Take profit can be placed accordingly concerning stop-loss, it could be set in the ratio of 1:1, but we must set our reward ratio more than the risk ratio.
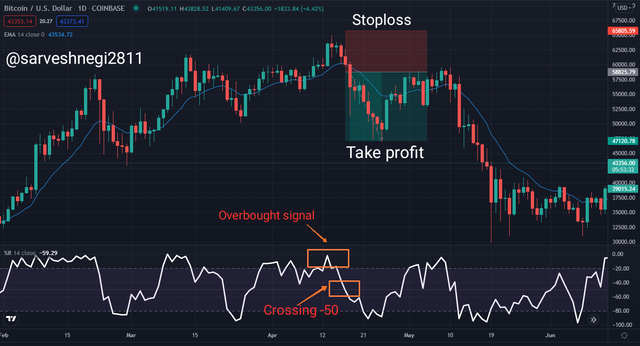
In the example below, you can see all the conditions of a sell signal or taking short position get fulfilled and I have placed my stop-loss at the resistance point created by the price for the previous 14 candles and placed my take profit level concerning stop-loss at the ratio of 1:2 risk-reward ratio.



Q-7. Conclusion


Williams %R is a versatile indicator that tells us about various signals in the market, it helps in spotting trends, trend reversals along with buy and sell signals. Being a momentum indicator it tells us about the fluctuations of the price in the market concerning the period of Williams %R and Williams %R is a leading indicator also that helps the trader to enter and exit the market at the early stage of the trend.
Settings of Williams %R indicator can be changed according to the traders and the trading style of the traders, using less period for Williams %R increases the sensitivity of the indicator which helps the scalp traders. Using high periods like 20 can make indicators noise-free or free of false signals but it will lag and provide late entry and exit.
Overbought and oversold signals are very good indications of trend reversals but they must be considered only after confirming or verifying the reversal by checking the value of Williams %R. As sometimes failure signals appeared in the market too and these failure signals trap the traders and make them suffer a loss, so it would be wise to confirm a reversal using EMA or checking the value of Williams %R.
Bullish and bearish divergences are very good indicators of a trend reversal though it is very hard to see them in the market, when they appear it is a very good opportunity for the trader to enter and exit the trade according to the divergence.
-20 and -80 are important values but -50 is also an important value as it confirms a trend, the value of Williams %R indicator must cross and go above or below the -50 mark to confirm an uptrend or a downtrend. Using EMA in conjunction with Williams %R indicator can help reducing or filter false signals and confirming a buy or a sell signal.
Overall, it is a very useful indicator when used carefully and in conjunction with other trend indicators or EMA to confirms the signals provided by the Williams %R indicator.

Thank you
That was all from my side
For the attention of professor @kouba01
Hello @sarveshnegi2811,
Thank you for participating in the 4th Week Crypto Course in its 4th season and for your efforts to complete the suggested tasks, you deserve a Total|10/10 rating, according to the following scale:
My review :
Work with excellent content, because you have taken every question seriously, allowing you to get answers that are precise and in-depth in its analysis and clear in its methodology.
Thanks again for your effort, and we look forward to reading your next work.
Sincerely,@kouba01
Downvoting a post can decrease pending rewards and make it less visible. Common reasons:
Submit
You have been upvoted by @sapwood, a Country Representative from INDIA. We are voting with the Steemit Community Curator @steemcurator07 account to support the newcomers coming into Steemit.
Engagement is essential to foster a sense of community. Therefore we would request our members to visit each other's post and make insightful comments.
Thank you.
Downvoting a post can decrease pending rewards and make it less visible. Common reasons:
Submit