Hey steemians
In this post I will be submitting homework task for @stream4u on topic pivot points(technical indicator)

Definition of pivot point
It is an indicator or calculation used in the technical analysis to keep track or determine the price movement of an asset in a market in different time intervals.
Pivot point can be calculated by taking average of the highest price of the previos day(intraday high), lowest price of the previous day(intraday low) and closing price of the previous day.
Previous day : Day before or prior to trading
Formula to calculate pivot point
Pivot point = intraday high(previous day) + intraday low(previous day) + closing price of previous day / 3
Bearish and Bullish sentiments
Now we have intraday high(previous day), intraday low(previous day) and closing price of the previous day then we can calculate or determine the location of pivot point in chart.
When trend in the market started moving above the pivot point, it tells or indicate about bullish sentiment.
When trend in the market started moving below pivot point, it tells or indicates bearish sentiment.
Resistant and support using pivot point
After calculating pivot point we can also calculate resistance and support levels, and that helps us in our entry point, exit point and position of stoploss.
In this task i will be taking about
Support 1 ( 1st low below pivot point)
Support 2 (2nd low below pivot point)
Support 3 (3rd low below pivot point)
Oversold zone
Resistance 1 (1st high above pivot point)
Resistance 2 (2nd high above pivot point)
Residence 3 (3rd high above pivot point)
Overbought zone
Use of pivot point
(1) To determine trend and price movement of an asset in a market.
(2) Useful in intraday trading.
(3) Suitable position of stop loss (to avoid loss).
(4) Can make entry and exit point by looking at support, resistance and pivot point.

If you see in the style section of pivot points, you will be able to see the Resistance and Support levels and the number you can see in the style section is Upto 5, means Resistance 5 and Support 5 levels.
Pivot point levels
(1) Main pivot level(PP) : This level is at the position of pivot point, and it shows the trend in direction, by giving Bullish sentiment whenever price goes above pivot level and by giving Bearish sentiment whenever price goes below the pivot level.
(2) Resistance 1 (R1) : This level shows the first resistance point above main pivot level and the price is supposed to bounce back downward(change in trend from bullish to bearish) when reaches it or break it to go more upward(more Bullish).
This level shows overbought zone.
(3) Resistance 2 (R2) : This level shows the second resistance point above main pivot level and the price is supposed to bounce back downward( change in trend from bullish to bearish) when reaches it or break it to go more upward( more Bullish)
This level also shows overbought zone.
(4) Resistance 3 (R3) : This level shows the third resistance point above main pivot level and the price is supposed to bounce back downward( change in trend from bullish to bearish) when reaches it or break it to go more upward( more Bullish)
This level also shows overbought zone.
- Note : Overbought zone means when an asset is being bought by many traders leading to the rise in the price of that asset.
(5) Support 1 (S1) : This level shows the first support point below main pivot line, the price is supposed to bounce back upward (change in trend from bearish to bullish) when reaches this level or break it to go more downward(more bearish).
This level shows oversold zone.
(6) Support 2 (S2) : This level shows the second support point below main pivot line, the price is supposed to bounce back upward (change in trend from bearish to bullish) when reaches this level or break it to go more downward(more bearish).
This level also shows oversold zone.
(7) Support 3 (S3) : This level shows the third support point below main pivot line, the price is supposed to bounce back upward (change in trend from bearish to bullish) when reaches this level or break it to go more downward(more bearish).
This level shows oversold zone.
Note : Oversold zone means when an asset is being sold at a very high rate leading to the decline or fall in its price.
So I have told about the pivot levels .

How to calculate pivot point
As I mentioned above pivot point is the average of intraday high, intraday low and closing price of previous day.
So the formula is :
Pivot point = intraday high(previous day) + intraday low(previous day) + closing price(previous day) / 3
Example : Suppose the highest price of steem yesterday was 40 and lowest was 33 and the closing price of previous day was 38, then pivot point for the day of trading will be :
Pivot point = 40 + 33+ 38 / 3
Pivot point = 111/3
Pivot point = 37
Calculation of R1 and R2
R1 = 2 × Pivot point - Intraday low(previous day)
R2 = Pivot point + [Intraday high(previous day) - intraday low(previous day)]
So if we go by example above :
Pivot point = 37
Intraday high(previous day) = 40
Intraday low(previous day) = 33
R1 = 2 × 37 - 33
R1 = 74 -33
R1 = 41
R2 = 37 + [40 - 33]
R2 = 37 + 7
R2 = 44
Calculation of S1 and S2
S1 = 2 × pivot point - intraday high (previous day)
S2 = pivot point - [ Intraday high(previous day) - intraday low(previous day)]
So if we go by example above :
Pivot point = 37
Intraday high(previous day) = 40
Intraday low(previous day) = 33
S1 = 2 × 37 - 40
S1 = 74 - 40
S1 = 34
S2 = 37 - [ 40 - 33]
S2 = 37 - 7
S2 = 30

For this purpose I will be using Trading view
Steps to add or apply pivot points on chart :
(1) Open Trading view and go to the chart section of any currency or stock.
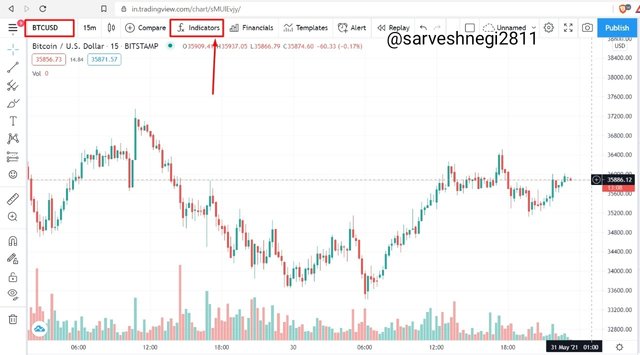
Step 1
(2) When chart appears, click on fx which includes indicators and strategies .
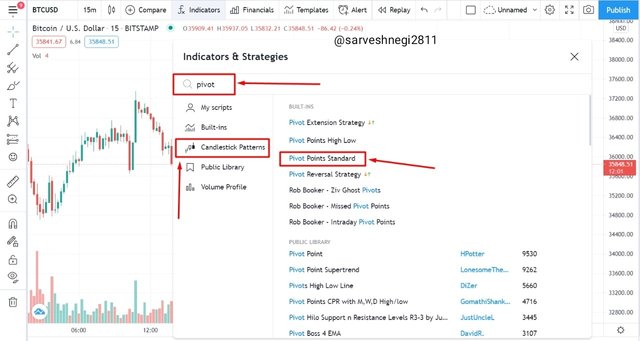
Step 2
(3) Write pivot point and choose pivot point standard under candlestick pattern and the process of applying pivot point is done.
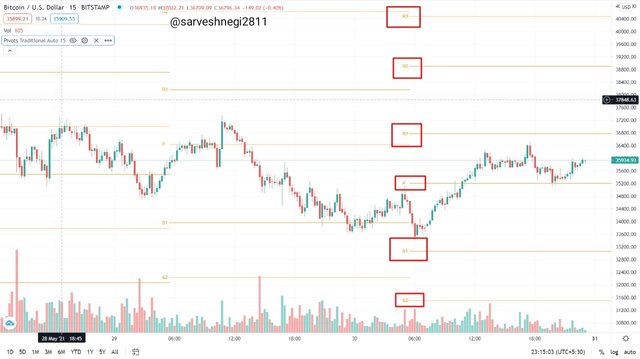
Step 3
Under the settings section of pivot point standard I went to to the styles option where I changed the colour of R1 and S1 to pink, R2 and S2 to black and S3 and R3 to green.
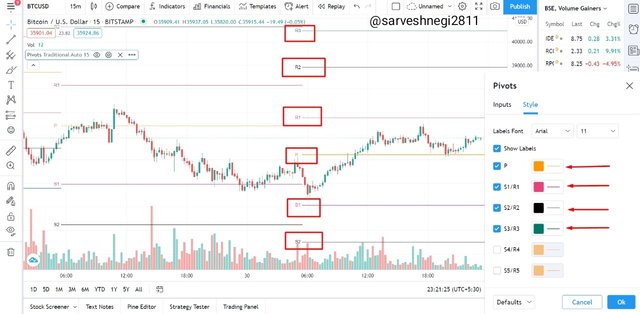
Style
Now input section of settings of pivot point standard, the type of pivot point is traditional by default, pivots time frame is set to auto and number of pivots back is 15 , all the settings are on default to make it easy to use and efficient.
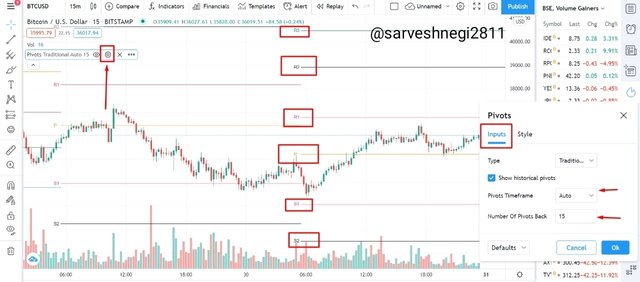
Inputs

I will be showing working of pivot points with the help of a chart of ETH/USD.
There appears to be 3 cases when using pivot lines :
(1) Bounce back from Resistance
(2) Bounce back from Support
(3) Breakout (Resistance/Support)
Example
I will be using a 15 min candlestick chart which covers 2 days trend.
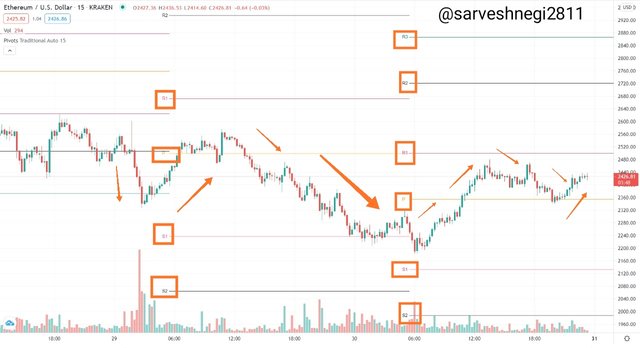
ETH/USD CHART
Explanation
The above example contains 3 different period with different pivot line and resistance/support line and I will be talking about all of them.
1st interval : This interval starts from 28 May 12 pm to 29 May 6 am.
In this you can see that on 28 may 12 pm the price is going down from Support1 to Support2 making a support breakdown and then it bounces back a little from the Support2 and reached Support1 but couldn't able to reach pivot line and started going down to Support3 making another support breakdown. After reaching Support3 it started to bounce back and moving upward.
So in this interval we have seen the work of Support lines and how price bounce back or breakdown occurs.
2nd interval : This interval takes place between 29 may 6 am to 30 may 6 am.
In this example above you can see that for this interval the pivot line and resistance/support lines have changed, this is due to the calculation of pivot points and resistance and support calculation from prior day data, so in this interval the price is rising above or moving upward to main pivot line and then without reaching Resistance1 it started going downward and stopped at Support1 and then a little bounce back can be seen.
So in this interval we have seen the work of resistance and support and how price bounce back after reaching those points.
3rd interval : This interval takes place between 30 may 6 am to 30 may 1145 am .
In this example you can see that the pivot point and support/resistance points have changes according to prior data . So in this interval price started going upward again from Support1 and crossed the main pivot line and went upward to Resistance1 and then startedmoving down from the point of Resistance1.
So in interval we have seen the work of resistance and support and how price bounce back after reaching those points.
Basically the work of pivot points is to tell about the trend in the market of an asset by :
(1) Bounce back from Resistance or breaking of resistance : if price bounce back from Resistance then trend changes from Bullish to Bearish and if price breaks the resistance level then more Bullish can be seen.
(2) Bounce back from Support or breaking of support : if price bounce back from Support line then trend changes from Bearish to Bullish and if price breaks the support level then more Bearish can be seen.

For this I will be using TRON/USD chart .
I will be using a 15 min candlestick chart which covers 2 days trend.
Example
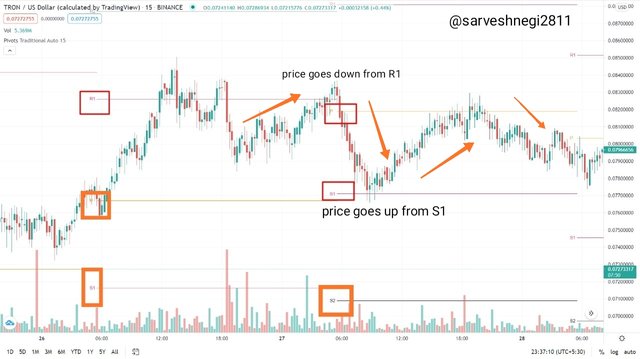
Reverse trading
In this example there are 2 intervals.
1st interval : 1st interval is from 26 may 6 am to 27 may 6 am .
In this example you can see the price is going up from the main pivot line towards Resistance1 making a Bullish trend but due to the volatile nature of cryptocurrency we can't say that it will always remain in Bullish region as it has reached the Resistance1, it started moving down and then again attain Resistance1 level .
So after looking this one can easily spot the exit point when price reaches the Resistance1 and make profit or wait for a breakdown or bounce back and then exit the market.
2nd Interval : 2nd interval is from 27 may 6 am to 28 may 6 am.
In this example you can see that all the points have changed including main pivot point and resistance/support levels , so for previous day the line which was main pivot line is now the support1 for next day , so price started going upward from support1 again and reached at main pivot point for 2nd day which was resistance1 for 1st day, so after price reached main pivot line it started moving down again toward support1.
By looking at the 2nd interval where the main pivot line of 1st day has changed into Support1 for 2nd day , one can wait and enter the market when price reaches support level and then when price bounces back from the Support1 and reach the main pivot line for 2nd day can leave the market while making a profit.
So you have seen how trend reverse after reaching suport and resistance levels and how can one make profit from them by making entry and exit according to trend of market.

We all make mistakes while trading, but the mistakes we make while trading with pivot points are :
(1) Choosing daily candle duration to get daily pivot points : Traders usually choose daily in the candle duration to get daily pivot points but they don't know that by choosing daily in the candle duration they are getting monthly pivot points.
Daily pivot points : plotted on candle chart of 5,10 and 15 min.
Weekly pivot points : plotted on candle chart of 30 min and 1 hour .
Monthly pivot point : plotted on candle chart of 1 day.
So one should opt for 15 min candle duration to get daily pivot points and to avoid the mistake.
(2) Choose longer period to trade : Traders apply pivot points on big time frames like weekly, monthly or yearly but pivot points are more efficient for intraday trading and pivot points changes with a very low frequency change in market so one should not apply pivot points on big time frames.
(3) Completely rely on pivot points : Some traders completely rely on pivot points for their trading so they don't look at price, supply and volume and just trade by looking at pivot points without knowing it will bounce back or not from resistance and support levels .
So one should use another indicator like MACD, Bollinger bands and stochastic along with pivot points to get accurate entry and exit points or position of stop loss.

There are many reasons for which traders use pivot points for trading and pivot point is supposed to be a good indicator that helps in trading, because of the following reasons :
(1) User friendly and easy to access :
As it is very easy to add pivot points on chart and one who has a little bit knowledge of resistance and support line can easily understand the working of pivot points and make profit .
(2) Plethora of signals : pivot point standard Indicator tells us about the resistance and support lines of an asset and by looking at them we can make our entry and exit point and can set position of stop loss, it also gives or tells us about the trend of an asset or reverse in trend.
(3) Constant value of pivot point for a day : This is the best feature of pivot point that the value of pivot point and resistance and support levels remains constant whole day and according to this a trader doesnt have to change his or her strategy to trade that asset.
(4) Calculation of pivot points : we can calculate the pivot point and different support and resistance levels as we know the formula to calculate main pivot point and other support and resistance level , so we can't have to rely on computer or software for the calculation.
(5) Can know about Bullish or bearish trends : As I stated above that if the price is going above the main pivot point the trend is said to be Bullish and when price is going below the main pivot point the trend is said to be bearish.
As we know that pivot point is the balanced point between bearish and Bullish forces in a market .

I have to use pivot point indicator and tell about how the price or market acting before and how it will be acting after that.
So for that I will be using a candle stick chart of 15 min.
The chart I am using is of TRX/USD.
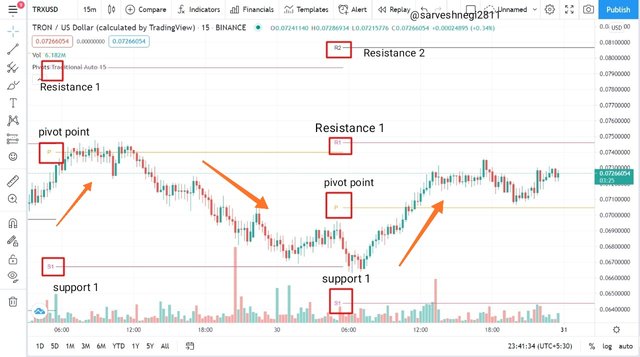
TRX/USD
There are 2 intervals in it, one from 29 may 6 am to 30 may 6 am and other from 30 may 6 am to 31 nay 6 am(my time of taking screenshot and doing homework).
1st interval : In the first interval you can see that the price is going towards the main pivot point and after reaching the main pivot point it stared falling down to the support levels, it reaches the level of Support1, after reaching support1 it started bouncing back and stared going in upward direction and then entered into next day or next interval.
2nd interval : In 2nd interval you can see that all the pivot points, main pivot point, resistance levels and support levels has shifted below the previous one because of the new calculation of main pivot line and resistance and support levels.
So in the 2nd interval it started from above the support1 and reached the main pivot point and then crossed it and went upward to Resistance1 but hadn't reached the resistance1.
So that was all before the time I took screenshot.
After that time

TRX/USD
As we can see that the price is between the main pivot point and Resistance1 , so there appears the 2 possibility :
(1) Resistance1 breakdown : If its price continue to grow or move upward it can reach upto the Resistance1 level making Bullish trend and if price won't bounce back from Resistance1, it will go more upward giving more bullish trend and can reach upto Resistance2 and Resistance3.
(2) Bounce back of price from Resistance1 : if price reaches the level of Resistance1 and after reaching the Resistance1 level it can bounce back from that level making a bearish trend and can reach main pivot point and can go below it to Support1 , so then there appears 2 more case, first is that the price can go below the support1 to support2 making more bearish trend or second is that the price can bounce back from the Support1 level and reverse in trend can occur from Bearish trend to Bullish trend.
So I have told about all the possibilities that can happen after I took screenshot.

Basic information or my thoughts about TRX
(1) TRX is the tokens or cryptocurrency used in the decentralized blockchain based TRON platform.
(2) Founded by Justin sun in 2017.
(3) It is a penny cryptocurrency, that means its value is below $1.
(4) It works on a P2P technology that means it does not need any mediators or intermediaries to confirm any transaction.
(5) Less coat of transaction from ethereum blockchain and that is why people choose TRON blockchain or TRX for transaction.
(6) With the help of TRX, you can lend, stake or supply other currencies which uses TRON platform and then can be able to get mining rewards for supplying and staking your TRX in the platform that runs on TRON blockchain.
Why TRX
(1) As it users P2P method for a transaction it does not need any mediators to confirm the transaction and that leads to a low cist of transaction that makes it a suitable option for new traders to use for transaction .
(2) As I stated above it is a penny cryptocurrency, now its price is $0.07, which is affordable for the traders who are new to trading world of cryptocurrency and don't have have that much of amount to trade in their hands.
(3) Market capitalization of TRX : $5B (approx)
And this much of market capitalization made it a no 24 coin in the list of coins .
(4) The more the market capitalization of a token or cryptocurrency the more it will be stable and that is one of the reasons traders and I choose TRX .
(5) Its 24hr high : $0.07502
Its 24hr low : $0.07
It hasn't changed a lot despite the fall in market.
Stability .
(6) We can choose the asset we want to trade in , I see a lot of potential in TRX because of its platforms like exodus and odyssey.
(7) Stages for decentralised gaming in future which are Star trek and eternity.
(8) TRX is included in one of the big exchanges like Binance and liquid.
(9) And the main reason is that I can get TRX on Steemit platform and then use them for staking and supplying in TRON platforms to make profit.
Technical analysis with price details
So for the technical analysis I will be using :
(1) pivot point(resistance and support)
(2) MACD
(1)
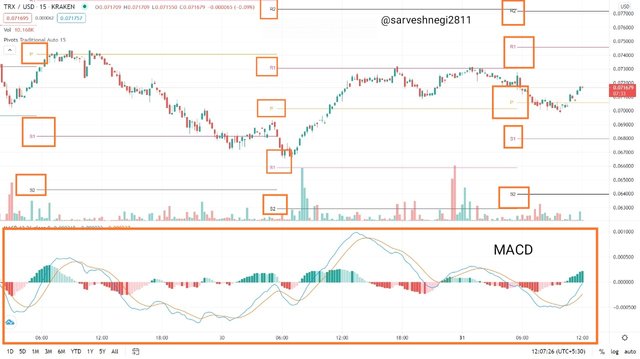
TRX/USD WITH PIVOY POINT AND MACD
- in the example above you can see that I have used pivot points and support and resistance levels and MACD indicator to predict the price of TRX/USD.
(2)
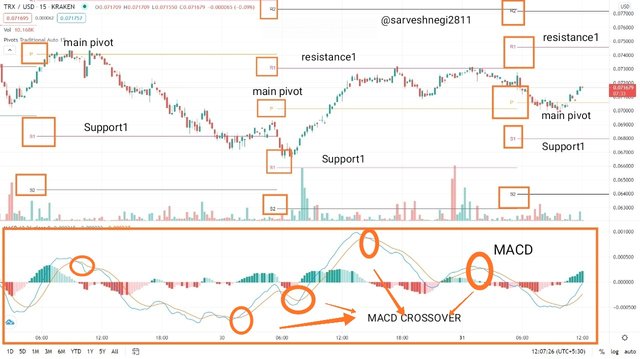
Resistance and support level with MACD crossover
For 1st interval
Main pivot point(P) = $0.074
Support1 = $0.068
In 2nd interval
Main pivot point(P) = $0.07
Resistance1 = $0.071
Support1 = $0.066
So you can see in the graph above that the price is going above from Support line1(0.068$) to the pivot point(0.074$), and after reaching the main pivot level there is an MACD crossover which is indicating that there is going to be a change in trend and at that time trend changes from bullish to bearish and price stared falling down from main pivot line to support level1 , then after reaching support level1, it bounces back again a little bit and you can see an MACD crossover showing change in trend then price entered into new interval having different pivot points or levels.
So in the new interval all the pivot point and levels have shifted below from the pivot point and levels of previous day .
So in the next interval, price entered the market at support1($0.66) and then bounce back from it to make a change in trend from Bearish to Bullish , you can see that in the MACD crossover, after that it crossed the main pivot line and then then reached the Resistance level1 and bounce back from it a little and started going up again and then enter into a new integral.
Prediction for next week
(3)
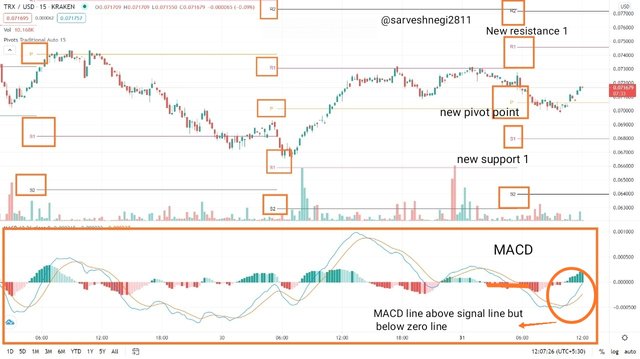
Price prediction
Main pivot point = $0.71
Resistance1 = $0.748
Support1= $0.68
- As you can see in the above chart the price is above the main pivot line($0.71) but below the resistance 1($0.748) , so my prediction is that its price will go up to the resistance 1($0.748) and then it will bounce back from there as you can see the MACD line is below the zero line and that is showing that the trend is not going to be bullish soon, then there appears 2 conditions:
(1) Resistance breakout : Resistance1($0.74) can be breaked an price can go upto $0.76 to the new resistance level.(very difficult to see)
(2) Bounce back from Resistance1 : price can bounce back frok Resistance1($0.74) and go down to support1($0.68) and further down to new support ($0.64)(likely to happen or sure to happen)
So I have predicted the price of the TRX by technical analysis using pivot points and MACD indicator as you asked .
Week low/week high
According to my technical analysis above :
Week high : $0.76(if breaks the resistance1 at $0.74)
Week low : $0.64(if breaks the support1 at $0.68)
And it can have stable value of $0.7.

In final remarks I want to say that pivot points and levels is a very good indicators if used properly while trading as it helps us in finding price movement and change in trend, so that one can plan strategy to how and when to enter the market.
There are many signals along with pivot point and these signals are resistance and support levels , so when a price reaches resistance level it breaks the resistance level or bounce back from it to cause a change in trend and same goes for support level when price reach support level it breaks the support level or bounce back from it to cause a change in trend.
Pivot point is a good indicator and easy to use but it must be used with the other indicators to get a sure knowledge about trend like MACD.
And at last I think if I were to use pivot point indicator I would use other indicators with it as it is not that much reliable .

Thank you
For the attention of @stream4u.
Hi @sarveshnegi2811
Thank you for joining The Steemit Crypto Academy Courses and participated in the Homework Task.
Your Homework Task verification has been done by @Stream4u, hope you have enjoyed and learned something new.
Thank You.
@stream4u
Crypto Professors : Steemit Crypto Academy
#affable
Downvoting a post can decrease pending rewards and make it less visible. Common reasons:
Submit
Thank you @stream4u.
Downvoting a post can decrease pending rewards and make it less visible. Common reasons:
Submit