Thank you professor @stream4u for the lectures. I really learn new things and I'm looking forward to the upcoming sessions.
Please join me as I answer the homework questions!
Task 1.
What Is The Meaning Of Support Can Become Resistance & Resistance Become Support, When and Where set Buy trade, Chart Example?
SUPPORT <----> RESISTANCE
While trading, the resistance level is a price ceiling drawn to indicate a level where asset prices are not expected to rise above. The support level indicates a set position or price floor which the price is not expected to fall below it.
However, resistance can become support if the price rises above the resistance line, breaking it and rising further. If after a while, it drops back to the initial resistance line, the new level at which the price was (before it started falling) becomes the new resistance while the first or initial resistance now act as the support. The first support would become the first stoploss.
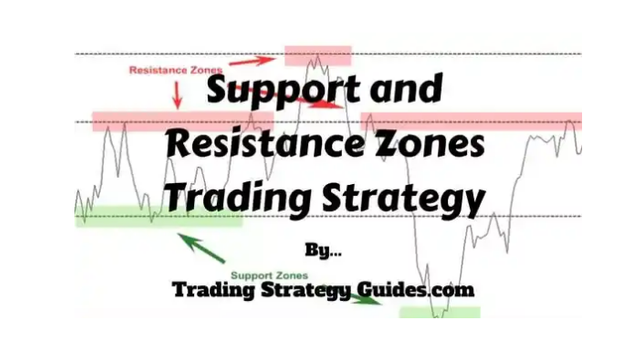
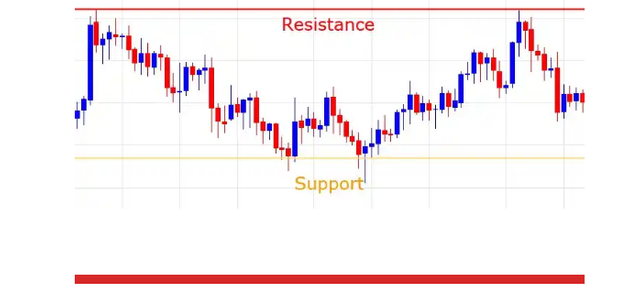 resistance and support from trading strategy guide
From the first chart, there are three lines showing the support, the initial resistance which later became support and the new resistance.
Task 2.
What Is A Technical Indicator? (You can explore it as much as you can, like explain its role, show anyone technical indicator from your chart and name of that Indicator.?)
TECHNICAL INDICATORS
Technical Indicators provide clear signals as to the real time for buy and sell. They are developed and implemented on the basis of past data collected with regards to the movement of assets.
Technical Indicators exist in charts to indicate the right time for entry and exit.
MYC trading indicator is an example of technical Indicators and it combines trend analysis and momentum oscillators to suggest the most accurate time for a bullish or bearish move.
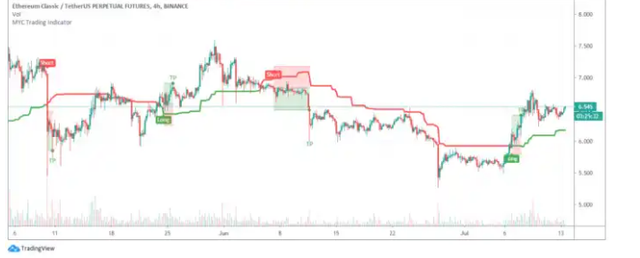 MYC Trading indicator chart
The chart Indicates the positions where a trader should go long and short.
Task 3.
Provide your view and explore TradingView.
I agree with our professor that TradingView provide better visuals on charts and allows access to all tools. Although I do not use TradingView, I would love to try it out sometime in the future.
Task 4.
What is 200 Moving Average, how and when we can trade/invest with the help of 200 Moving Average? Show different price reactions towards 200 Moving Average
200 Moving Average
200 Moving Average is an indicator that shows the movement of asset prices in the last 200 days; and this could be used to identify the assets that can yield good return in the long run.
Entry could be made if the price is approaching the 200 moving average from downwards and then and crosses the line upwards. Meaning there is a potential uptrend.
In contrast, if the price is approaching the 200 Moving Average from upwards and then it crosses the line and heads downward, it indicates a potential downtrend, therefore indicating when to close trade.
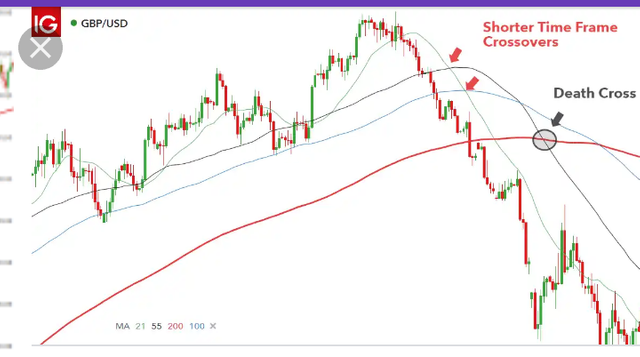 screenshot of 200 moving Average chart
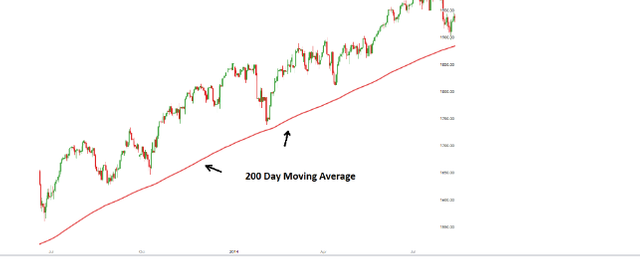 another screenshot of 200 Moving Average chart
From the charts, we can see the different price movements at all levels for a period of 200 days as well as the downward and upward trend at various levels.
These trends help traders to determine entry and exit points.
Thank you for reading through.. Appreciate
Hi @senicbliss
Thank you for joining Steemit Crypto Academy and participated in the Homework Task 4.
Your Homework task 4 verification has been done by @Stream4u.
Thank You.
@stream4u
Crypto Professors : Steemit Crypto Academy
Downvoting a post can decrease pending rewards and make it less visible. Common reasons:
Submit
Thanks for the review. I'll try as much to improve on it next time. Thank you
Downvoting a post can decrease pending rewards and make it less visible. Common reasons:
Submit