.jpg)
I am writing this post in response to the assignment task given by the professor @fendit , I really enjoyed, understood very clearly and really appreciate and thankful to you for your lecture.
A) Share your understanding on this lecture by answering the following questions:
What's the application of Elliott waves theory?
Answer: Elliott Wave is a principle theory used as a tool in Technical Analysis which helps in predicting and analyzing the moves of any market (ups and downs) and identifying the traders' psychology collectively. In candlestick chart we form pattern of waves according to the Elliott Wave theory and try to identify the market sentiments of the related financial market pair. This helps in trading as a strategy and well applicable in financial markets.
- What are Impulse and Corrective Waves? How can you identify them?
Answer:
.jpg)
Impulse Waves : It is a pattern which indicate strong trend in any financial asset. It is a trend identifying pattern as per the Elliott Wave theory and helps us in finding the one directional pattern movement either upward or downward. Collectively 5 waves pattern are formed in Impulse Waves as 1,2,3,4 and 5 and make net one directional movement . If it is a uptrend pattern then we have to buy and if pattern is indicating downtrend then we have to sell .
It has 5 sub-waves and they are :
Wave 1: Wave 1 is the first move while in an ongoing trend . It represents small amount of volume entered into the market or related market pair or assets . Normally small traders lead the Wave 1 initially and it follows the current direction of the market.
Wave 2: Wave 2 is a small negative retracement from the Wave 1 level and we can see small negative change in ongoing price and direction. It is because some traders trade for quick profits, when they start quitting or selling, we see this wave 2 formation.
Wave 3: Wave 3 is the longest and positive candle or price move formation on the net direction following the long market trend . As the price again start moving on the direction of the market trend people start heavy buying and price quickly moves up of the asset.
Wave 4: Wave 4 is a small retracement from wave 3 level. Selling and profit booking is the reason for Wave 4. Traders book their profits and when they start quitting or selling , price comes down and form pattern of wave 4.
Wave 5: Wave 5 is formed because trades buy on fomo following the market trend after retracement. In fear of missing the pump and profits, traders try to accumulate assets for profit on high prices and price is pumped. This is how wave 5 pattern is formed.
%20(1).jpg)
Corrective Wave: Corrective wave is the opposite directional pattern which is formed after completing the 5 impulse waves in opposite direction of the impulse wave and market trend . Correcting waves consist of 3 waves A, B and C . Sometimes it wont be easy to identify the correcting waves intially so there are 3 kind of formation by which we can identify or spot the formation. Those 3 formation in correcting waves are as follows:
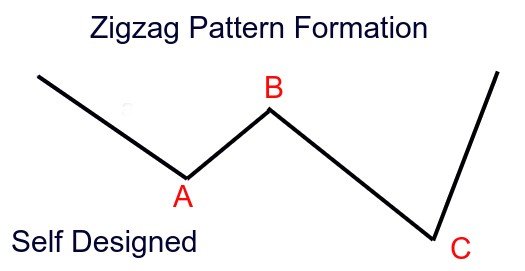
Zigzag Formation: Zigzag pattern is movement in price that go against the current trend. Wave B is usually shorter than A and C . These zigzag pattern can happen twice or more than twice . This is how we can spot the zigzag pattern formation.

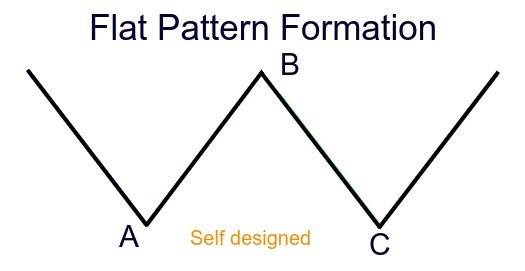
Flat Formation: Generally Flat pattern are sideways correcting pattern , Flat pattern waves are nromally equal in length. Waves A, B and C will be in equal length as we can see in the image below :

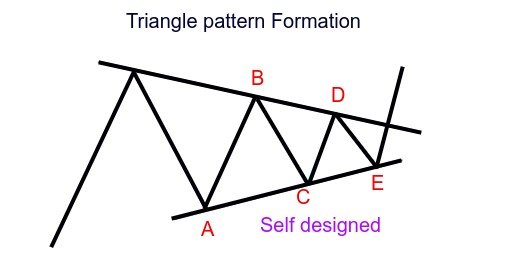
Triangle formation: Triangle pattern normally consists of 5 waves and it moves in sideways like pattern. These triangles can be symmetrical, descending, ascending, or expanding. Triangle pattern are formed due to low volume or volitality. we can understand the triangle pattern formation from below image :

What is your opinion about this theory? Why?
Answer: Elliott Wave Theory really helps in identifying the market movement - ups and downs and potential trends of the market. it helps by indicating the movement of the persistent change in the sentiments of the traders in long trending market. Impulsive waves provides the idea of initial movement of trend and where to enter and where to exit . Similary corrective waves provides information about change in traders' sentiment and market reversal or trend reversal. Following the theory propery we can make good money. Because it helps in predicting the next move in the market . Following this theory we can enter into the market in initial pattern and exit after taking our profit , it also helps us in avoiding FOMO buying or selling .By following this theory we can take lots of short trades as well in retracement areas. It also provides potential reversals of the trend which saves us from losses. If followed and used properly this is really gonna help us.
.jpg)
B) Choose a currency and on its chart, indicate where the full cycle of the impulse and correction waves is located. Explain in detail what you see. You must include screenshots and name which currency you are analyzing.
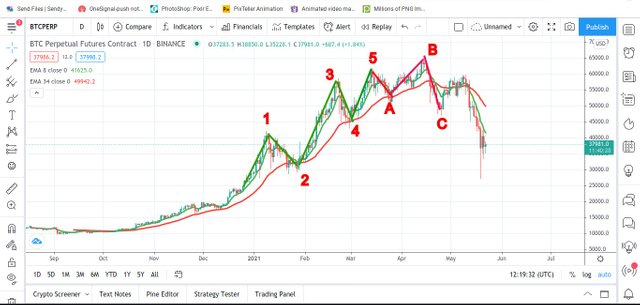
Answer: I am showing The Impulse Waves formation and Correcting Waves formation on BTC chart in 1 day frame candle chart in the image below :

Image source: Screenshot taken from Trading View and designed the formation of Elliott Wave by myself.
You can see clear pattern formation of Elliott Wave in the chart, first Impulsive waves and then Correcting waves formed in 1 day candle chart. As on 8th January 2021 1st impulsive wave was formed ( btc price was $42100) and the price retraced from that level and on 21st January 2nd wave was formed($28309) and price started upward following the long term market trend and price reached $5860 as of 21st February and formed 3rd impusive wave. Again price retraced till $38450 on 1st march and formed 4th wave and price again followed the market trend and Elliott Wave theory and price pumped and reached $61798 on 13th March 2021.
After completing the 5 impulsive waves it started following Correcting waves and market trend started changing toward downwards . On 25th march the price dropped or corrected down till $50047 and formed A correcting wave and after that price moved toward upside till $65100 as on 14th april , Formed and completed B correcting wave. Now price started dropping downwards at hit the price of $46110 and completed C Correcting wave.
In impulsive wave 1, market trend was followed and initial investors entered into the trade. After making profit they exit from the market or selling happened by them. So, price drops little and wave 2 is formed. Again following the market trend which is upward , new traders or other traders enter into the market with good volume and price pumps with highest volume and make a big candle or price movement which forms wave 3 . Here people start selling and booking profit so the price is again retraced and wave 4 is formed. After the retracement price tend to go upward following the market trend , again traders enter into the market in fear of missing and price goes little up and forms wave 5. Now the Impulsive wave cycle is completed and now Correcting wave starts. First Price drops from the Impulsive wave 5 and form Correcting wave A, now traders who do not know about the market cycle and theory and people who don't have technical analysis skills they keep buying and pushed the price little bit up where Correcting wave B is formed. But as the market trend and momentum is changed smart traders start selling and price drops from there and price comes downward and Correcting wave C is formed.
.jpg)
CONCLUSION: Elliott Wave Theory is a working and very helpful theory if understood , used and implemented properly. I really liked this theory and the strategy that really works as i have also shared the screenshot of BITCOIN chart and formed the Impulsive waves and Correcting waves according to the Elliott Wave theory. I will definitely follow and try to implement in my upcoming trades.
NOTE: There is no tool or strategy that works 100% always , you also have to study and do research by youe own and to avoid huge losses i always recommend using Stop Loss on your all trades.
All images used into my post are created and designed by myself except trading view chart which i have already mentioned above in source
.jpg)
Thanks Professor Thanks Professor @fendit for this beautiful and interesting lecture. I'm looking forward to your next lecture.
CC: @fendit
@steemitblog
@steemcurator01
@steemcurator02
Thank you all steemians for reading !
Thank you for being part of my lecture and completing the task!
My comments:
Your work was fine, but I believe you could have ellaborated a bit more your answers... they were too simple in some points.
Overall score:
5/10
Downvoting a post can decrease pending rewards and make it less visible. Common reasons:
Submit
Thank you so much professor for verifying my post .Thank you so much for your kind suggestion, I will try my best in upcoming posts !
Downvoting a post can decrease pending rewards and make it less visible. Common reasons:
Submit