I would first like to thank this community. To increase my knowledge about Mastering the Sharkfin Model for Trading of SEC S19-W4. I am participating in this contest with my minimal knowledge.
I am inviting three of my friends to participate in this contest. And for their convenience I am sharing this contest link here.
Contest Link 👇
SEC S19-W4 || Mastering the Sharkfin Model for Trading . I invite some of the skilled users I know to participate in this contest. "Honorable Mentions:
@rashid001 @radjasalman @ripon0630
 |
|---|
The SharkFin model refers to two distinct concepts in different contexts:The SharkFin model refers to two distinct concepts in different contexts:
(i). SharkFin Structured Product:
- SharkFin is a principal-guaranteed structured financial product where our investors can earn higher returns while the position direction of which does not affect the investor’s principal.
- Key features:
- Principal Guarantee: In this manner, one gets back his initial amount of cash, regardless of factually incorrect market forecast.
- Variable Yield: The yield is thus variable and depends with the type of SharkFin product being used and with market conditions.
- Price Cap and Floor: The yield rises with a change in the rate of the underlying asset in the direction forecasted by the ETN, bullish, or bearish but is limited by a certain price level for bullish ETNs or by a floor for bearish ETNs.
- SharkFin Shape: The income curve is also referred to as the shark fin which stands from the water body.
- Bullish SharkFin: : They show that when a call SharkFin product is bought, the yield rises as the price advances to cap which is the asset price.
- Bearish SharkFin: Should a bearish SharkFin product is bought, the yield is higher with the decrease of the said asset’s price up to a certain minimum price level.
(ii). SharkFin Model (Consumer Behavior):
- In another context, the SharkFin model defines the pattern of buying.
- It categorizes consumers into two types:- It categorizes consumers into two types:
- Trial Users: Consumers who use new products or services in a product category for the first time because the receive emotional benefits from them and they are also ‘afraid’ of missing out.
- Other Consumers: People who do not immediately run into innovation and appear to leave a different behavior model.
.jpg) |
|---|
SharkFin pattern on a price chart can be defined as the certain yield behavior described above, enabling to conclude on the presence of SharkFin pattern. It is graphic like a shark fin, characterized by slow progress followed by a barred or compromised increase. These are the characteristics which are helpful when it comes to analyzing financial products and consumers’ behavior!
Based on theory along with empirical evidence, the SharkFin pattern can be spotted with the help of Relative Strength Index (RSI) indicator. Let's break it down:
(i) **Define SharkFin Pattern. **
- A SharkFin pattern is implemented when the price moves up and immediately starts moving down (or moving down and up).
- The RSI Price Line which is usually green in colour falls and crosses the overbought line and then moves down sharply to below the over bought line in the form of a shark fin.
(ii). **How to Spot SharkFins Using RSI:Thus, since ** is replaced with the value 2 in this case, the procedure is equivalent to finding a range of values that includes 2 and whose difference is greater than 1 but less than 2.
Upper SharkFin (Bearish):
When the RSI is above a stated line, usually above 70, then moves above the upper volatility band, and then below that level, a bearish SharkFin is created.
This pattern indicates that RSI increased rapidly and it is evenly expected to decrease further to give a SELL trading signal.
Lower SharkFin (Bullish):
For a bullish SharkFin, the opposite occurs:- For a bullish SharkFin, the opposite occurs:
The Relative Strength Index goes below a certain value, typically the oversold line, which in turn goes below the lower volatility line, and finally rises again above that line.
This reveals that RSI decreased sharply and it should increase again, thus would be a BUY signal.
.jpg) |
|---|
(iii). Example Metrics:
Overbought Level: Generally raised to about 70 per cent. RSI is renowned as being overbought when moves above this level when bearing the possibility to provide bearish signals.
Oversold Level: Often, it is fixed at around 30. When RSI moves below this level, the reading shows over-solding.
Price Bands: The upper and lower volatility bands assist to establish the SharkFin pattern. When prices escape these bands, it connects to the sharkfin formation of RSI.
Keep in mind that SharkFin pattern is a helpful signal for a trader to predict price changes based on RSI movement. Be on the lookout for these on price chart graphics!
When applying the SharkFin model to the Steem (STEEM) token, here are the trade entry criteria and specific signals to look for:When applying the SharkFin model to the Steem (STEEM) token, here are the trade entry criteria and specific signals to look for:
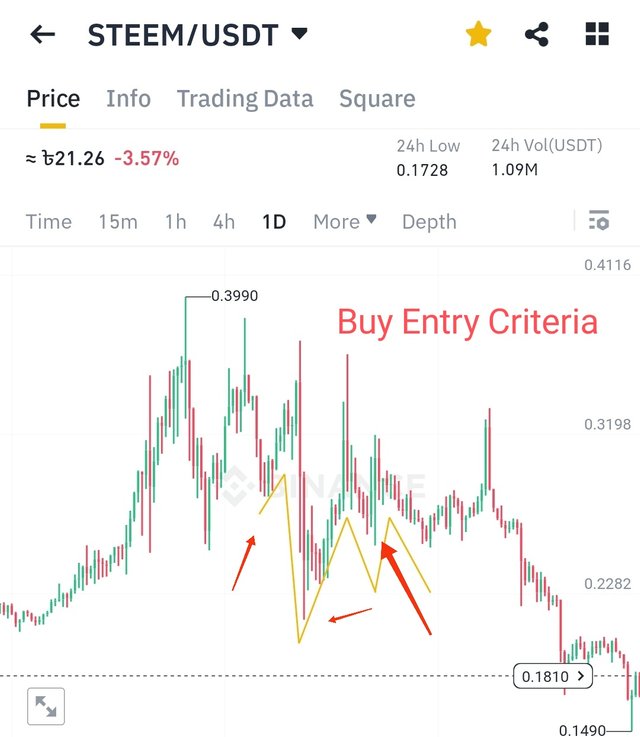
(i)Buy Entry Criteria:
- Green Line vs. Red Line: The TDI (Traders Dynamic Index) should be below the 0.00 level with the green line of the TDI indicator below the red line.
- SharkFin Formation: You should look for an appropriate angle going upward which is bullish and should form a ‘Shark Fin’. The further and deeper the angle of the cut the work is.
- Proximity to Blue Band: The green line should be right on the outer blue band.
- Additional Filters: Bear in mind other disgraced filters, for example, custom volume filters that should correlate with the said setup.
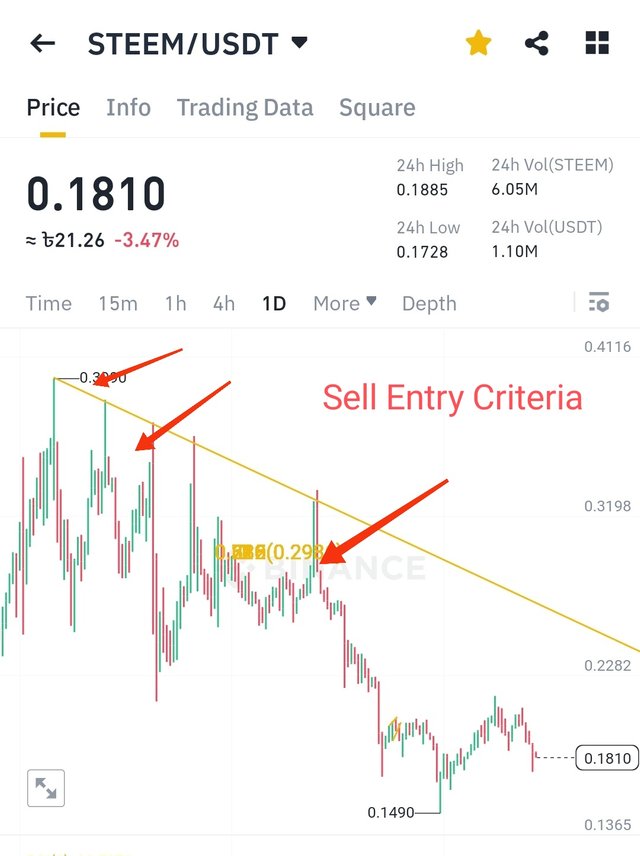
(ii). Sell Entry Criteria:
- Green Line vs. Red Line: The green line should be behind the red line.
- SharkFin Formation: For a Bearish indication look for a sharp angle downward in the Green line forming a Shark Fin like appearance.
- Proximity to Blue Band: Like in buy setup, the green line should be on the outer blue band or very close to it.
- Additional Filters: This must be done for the discretionary filters to work in line with the bearish formation.
(iii). Exit Strategies:
Exiting the trade can vary based on different variables:- Exiting the trade can vary based on different variables:
Scalping Approach: If you are a scalper, it is advised to place your SL at a very small point and take profit at the beginning of the following candle.
Other exit ideas include:- Other exit ideas include:
1:1 with Recent Swing: Exit after attaining or nearing a recent identified high or low in the prices.
ATR-Based Exit: As proposed by the strategy’s name, decide on a preliminary fixed number of pips to trade in relation to the ATR or the chosen currency pair’s volatility.
Market Structure: Look at the places such as support/resistance levels, supply/demand zones, or gaps at fair value.
(iv) Ideology Behind the System:
TDI is accurate and with the SharkFin pattern added makes it even more accurate.
When used in conjunction with other confluences these may reach an accuracy ranging from 75 percent to 80 percent.
Please, do not forget that all these criteria should be tailored to your trading style and tendencies. Here's to successful trading !
Sharkfin model is an engaging trading approach; when applied to Steem token, one gets an idea on when to sell. Here are the trade exit criteria for the Sharkfin model:Here are the trade exit criteria for the Sharkfin model:
(i) Buy Rules:
- The green line of the TDI (Traders Dynamic Index) indicator should be placed beneath the red line and also the outer blue bands.
- The green line goes upward in such a way that it forms a ‘Shark Fin’ that is, an angle with the distinguished blue band. Ideally, the larger and sharper the angle, the better would be the coupling of the sheet with the die.
- The green line should be bordering the blue band very tightly.
(ii) Sell Rules:
- Green line should be on top of the red line and the outer blue bands.
- The green line forms ‘Shark Fin’ form here; however, the angle of this ‘shark fin’ slopes downwards towards the blue band.
- Once more, the green line must be positioned extremely close to the blue band.
(iii). Exit Rules:
- Depending on several factors, the exiting itself can also be changed and there is no specific rule for it.
- If you are a scalper, you may prefer to have a very tight stop loss and close the trade at the next candle with profit; especially if your trading is in the fast moving markets.
- Some of the other types of exit strategies are to take profits at the recent swing levels, at the ATR based pip targets or at the market structure.
Do not forget that the Sharkfin model itself integrated with other conjunctions can get actually 75% to 80% precision rates. Don’t be afraid to try something different and test the strategies that would fit your trading personality!
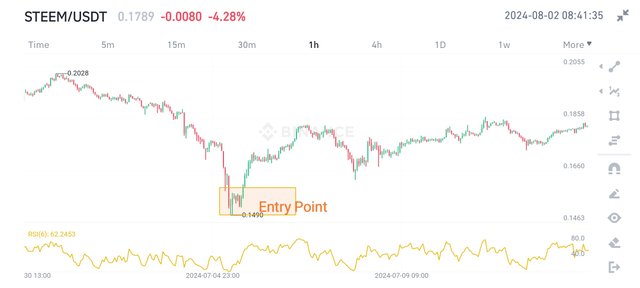
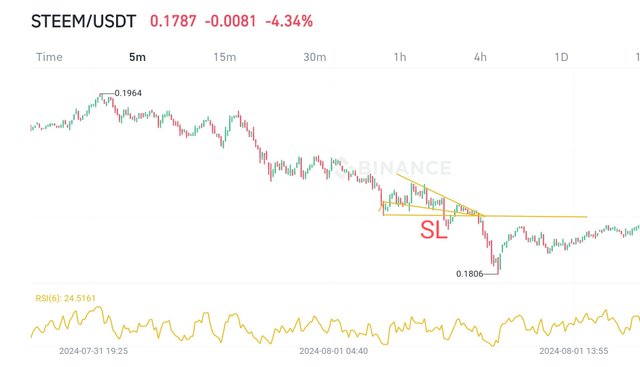
Always ensure to go back and check the timeline and other graphs to ensure the exit strategy is perfect.
So, let’s go deeper into the SharkFin model and then describe this model when making a transaction with the Steem token. Please understand that as a result I will not be using the current data for the projected but I will have to use an example based on past data.
The SharkFin Model
The SharkFin model is the binary system of trading that was developed to make frequent and safer profits on any given security. It has features of both the trending and the mean reverting styles. Here are the key steps:Here are the key steps:
(i) Identify the Trend:
- Look at the Price chart of the Steem token for a particular period.
- Try to find a clear trend in restaurants and/or chains choice.
(ii). Entry Point: We can say assume that we observe that the price of Steem is going down. One should wait for one major price drop to occur before one is able to get a buy and sell signal. Possibly, our entry point could be when the price begins to constitute the decline after touching the lowest point.
(iii). Exit Point:One has to set a goal or a target price for the trade that he or she wishes to enter. This could be an increase from the entry point, perhaps in the form of a certain percentage. instead it is advisable to use trailing stop loss to lock in profit as the price yarns with the direction of the trend. Get out of the trade at the target or stop-loss level.
Hypothetical Example
Let's assume the following scenario:Let's assume the following scenario:
- Timeframe: Daily chart
- Steem Price:
- Day 1: $0. 50 (downtrend)
- Day 2: $0. 45 (shark's fin)
- Day 3: $0. 48 (reversal)
- Day 4: $0. 55 (continuation)
- Day 5: $0. 60 (target reached)
(i). Entry:
- On the third day we seem to have a slight recovery in the price as it bounces back from the shark’s fin.
- For the above trade, we invest at $0. 48.
(ii). Exit: Based on played markets and conservative approach, the target was set on 20% gain. Our target-price is $0. 58. Or else, there is the trailing stop loss placed at 10% below the day’s high price which was $0. 54.
(iii). Outcome: By the fifth day of the increase of prices, the price reduces to $0. 60, exceeding our target.
- We close the position with $0.25 profit or $0.60-$0.48 = $0.12 for every unit of the currency pair.
Reasoning:
The SharkFin model exploits a part of a longer-term trend that moves in the opposite direction for a while. Our exit strategy meant that we held profit and were able to leave room for additional profits to be made.
Hope you enjoyed. Thank you so much for reading my content so far. My value is only if you can gain minimal knowledge by reading my content. I am ending today's content here wishing everyone good health.
I invite you to support @pennsif.witness for growth across the whole platform through robust communication at all levels and targeted high-yield developments with the resources available.
 Click Here
 Thanks for reading the Post
02/08/2024
The End |
|---|

X promote : https://x.com/Shahari73599011/status/1819220543528489363
Downvoting a post can decrease pending rewards and make it less visible. Common reasons:
Submit
You shared your very nice information on the Sharkfin model for trading. Information along with examples make eaiser to understand the concept. The details of the entry and exit criteria are helpfull.
Downvoting a post can decrease pending rewards and make it less visible. Common reasons:
Submit
Thank you so much for reading my post and leaving a nice comment.
Downvoting a post can decrease pending rewards and make it less visible. Common reasons:
Submit
Hello sir greetings.
Thanks for sharing your wonderful piece of work with us. I'm really impressed with your demonstration on the piece of work.
You got me reading deep. Follow up, u made a good explanation of what the sharkfin model is all about. Using charts to demonstrate.
I equally love the way you explain the use of RSI in correlation with the sharkfin model. This piece of work demonstrate mastery of the topic.
Overall, your entry is good. Good luck 🤞
Downvoting a post can decrease pending rewards and make it less visible. Common reasons:
Submit
I am very glad that you liked my detailed description. Thank you very much for inspiring me with a nice comment.
Downvoting a post can decrease pending rewards and make it less visible. Common reasons:
Submit
You have written so well on the entry and exit criteria of the sharkfin model. Identifying the trend before going into the market is one major thing that must be done to avoid counter-trade. If you added an image or images to this part of your work it could have been more beautiful. I wish you success, my friend.
Downvoting a post can decrease pending rewards and make it less visible. Common reasons:
Submit
Thank you very much for your advice and your comments
Downvoting a post can decrease pending rewards and make it less visible. Common reasons:
Submit
The Sharkfin model is a useful trading model which helps to locate reversal extreme level of the market. The most important level that can be identified by analyzing the prices and use of Relative Strength Index is that of overbought or oversold conditions. This pattern assists in working out the points of entry and exit, gets the best from sales and minimizes on risks at the same time. Thank you very much for sharing and best of luck my dear friend.
Downvoting a post can decrease pending rewards and make it less visible. Common reasons:
Submit
Thank you very much for inspiring me with a nice comment.
Downvoting a post can decrease pending rewards and make it less visible. Common reasons:
Submit
Greetings, my friend @shahariar1,
It's awesome to see how you explained the Sharkfin model. The way you detailed the RSI metrics, like overbought and oversold levels, makes it super easy to spot those sharkfins. 🦈
Great job on making trading so understandable and fun!
Downvoting a post can decrease pending rewards and make it less visible. Common reasons:
Submit
Downvoting a post can decrease pending rewards and make it less visible. Common reasons:
Submit