This is Shahariar , From Bangladesh
DATE: 27/09/2024
In the third week of Trading Simplified, we will go through understanding and identifying market fractals, which were discovered by Bill Williams. Market fractals help traders predict market reversals since patterns can be repeated on price charts. My goal is to use this concept for trend reversals and recognizing future price changes. Fractals are great by themselves but by using them with other future indicators I hope to sharpen the performance of models and create rather complex trading plans for Steem tokens. Don't miss the detailed coverage of this interesting topic!
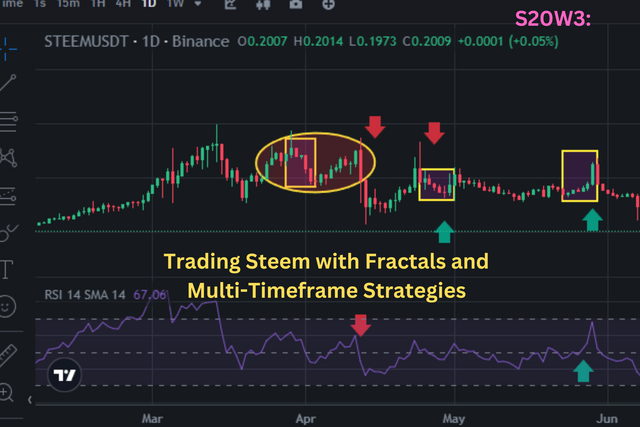

Explain what market fractals are and how they can be used to ?

Market fractals are referred to as self-similar patterns in different financial markets to understand when a particular pattern may reverse in the market. These patterns consist of five consecutive bars; namely, five black bars arranged horizontally. The bullish fractal, a five-bar pattern, is constructed when the middle bar contains the lowest bar low with two higher lows bar prices situated to the left and right of the middle bar bar indicative of an upward reversal. On the other hand, a bearish fractal is created when the middle bar of the pattern has the highest high while the bar on its either side have lower high and could be a sign of reversal to the downside.
Fractals are indicators that are always backward indicators, which indicates that they give confirmation of something after it has begun. It is worth using them together with other technical indicators to increase the level of detail. For instance, a bullish fractal in the cryptocurrency STEEM means that if the price reaches a low point and starts increasing, it may form a bullish fractal pattern whereas a bearish fractal means a situation whereby the price reaches a high point and starts falling forms a bearish fractal pattern.
EXAMPLE:
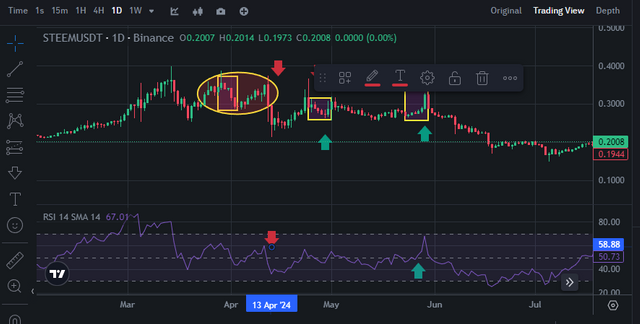

Question 2: Combine Fractals with Other Indicators

When used in conjunction with other indicators, then fractals can help to seriously augment trend forecasting for trading. Fractals are more useful in determining reversal points than other indicators such as RSI, moving averages, and the Alligator.
RSI: It is also possible to use fractals to confirm signals given by RSI. For example, when the stochastic is oversold and a bearish candlestick pattern occur, the signal to go short is confirmed. On the other hand, the bullish fractal in an over sold RSI condition gives the buy signal.
Moving Averages: Combining fractals with the moving averages is useful in determining direction and the possible entry points. For instance, when a bullish fractal is developed above a moving average, then the trend is that of an upward movement. On the other hand, a bearish fractal below the moving average indicates a possibility of bear run.
Alligator Indicator: The Alligator positions three smoothed moving averages – the averages help to define trending and non-trending markets. If it is incorporated with fractals, it can I give clearer signals. For example, when a bullish fractal occurs while the Alligator’s lines are widening upwards, the signal is a strong buy signal. Similarly, if the blue Alligator’s lines are directed downwards, a bearish fractal indicates the sell signal.
When used together, traders can get better results of the trends making their trading plans even better.
EXAMPLE:
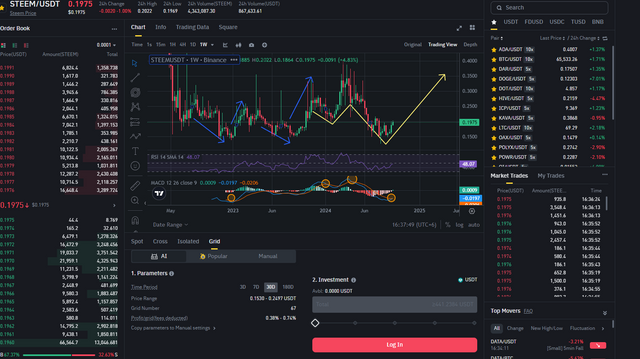

Question 3: Using Fractals Across Multiple Time Frames

Combining fractals with a number of periods can give a deeper understanding of the market characteristics and potential reversal levels and trends. It’s time to look at what can be done with fractals in the perspective of the daily and weekly Steem charts and their interrelation for the purpose of improving a trend forecast.
Daily Chart
For short-term reversal points in a daily chart, fractals come in handy. For instance, when a bullish fractal is found, there are chances for an upward reversal to occur. On the other hand, a bearish fractal may be interpreted as a possible reversal of the bias to the downside.
Weekly Chart
On the weekly timeframe, fractals speak volumes of longer trends. Positive fractal within a weekly chart means an extended bullish pattern, and the negative fractal – an extended bearish pattern.
Demonstrative Example on Steem Chart
Let's consider a hypothetical example of Steem over the past week:
Daily Chart:
- Bullish Fractal: Came out on Monday which may suggest a near-term reversal to the upside.
- Bearish Fractal: If it appeared on Thursday, then it possibly implies a short term reversal to the lower end of the cent range.
Weekly Chart:
- Bullish Fractal: Posted last week suggesting that it may continue to rise in future.
Integrated Market Analysis
Combining these signals:
From the above weekly chart, there is a bullish fractal indicative of a long term trend upwards.
This daily chart Bull Fractal on Monday corresponds to weekly, meaning a very Bullish buy signal.
Implications of bearish fractal for Thursday is that there is a short-term pull back that is lined within an overall bullish trend hence should provide an entry at a higher price.
On that basis, if fractals are plotted on different time frames, it will go a long way towards helping traders. The estimated temporal multiple analysis contributes to the recognition of short-term gains and long-term patterns, the improvement of trading strategies overall.
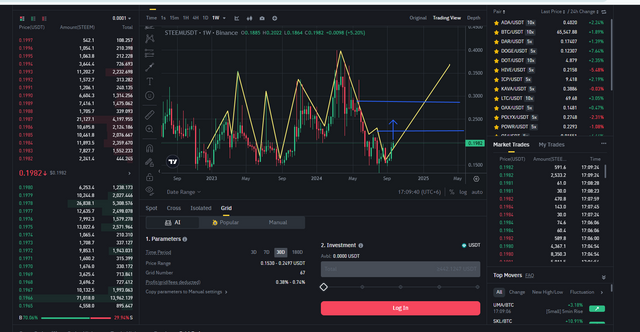
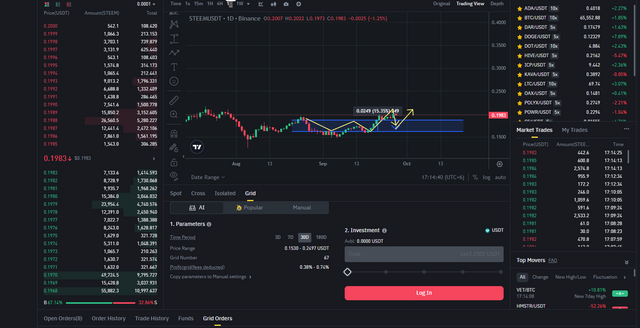

Question 4: Develop a Trading Strategy Based on Fractals

Trading strategy of Steem through Fractals
Entry Point:
Bullish :There is also the break of a bullish fractal on the dailly chart which is a sign of an upside reversal when there is a bullish bar.Get out of the positions when, in one-day chart, there is a bearish fractal that suggests a change in the trend in most cases downward.a sign of an upside reversal.
Exit Point:
Bearish: Exit the positions when in the daily chart one can observe a bearish fractal which may indiecate that there is a change of trend more so downwards.
While placing this stop loss one should make sure it is below the most recent bullish fractal low as to minimize on risks.
ExampleDaily Chart: On Monday an upward bullish fractal formed at $0.184.
Weekly Chart: Analyzing the last week framework, starting with a step higher, one can identify a long-term bullish fractal.
Detailed market analysisEntry: It is $0.184 (The bullish fractal created at Monday)
Exit: $0.194 which was the low bearish fractal formed on Thursday.
Stop-Loss: $0.180. This strategy involves using fractals across several time frames to enhance the performance of the trends being used.


Question 5: Analyze Steem’s Current Market Trend with Fractals

Next, fractals on the price chart of Steem are used to determine its current market position based on fractals. In fractals, reversals occur at five bar patterns and the middle bar is the highest high for a bearish fractal or the lowest low for the bullish fractal.
Current Fractal Analysis:
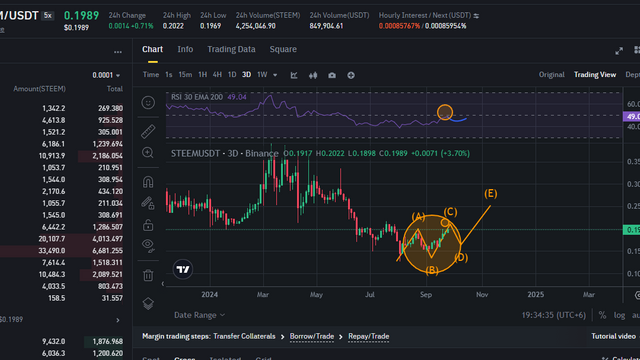
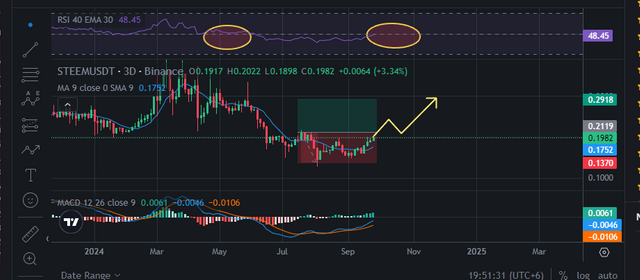
At the moment there is the bearish fractal cycle for Steem. This is clearly illustrated by the recent prices establishing pattern where the middle bar is the highest high separated by two lower highs that are one on the right and the other on the left side. This implies that there is a possibility of it decreasing in future.
Next Possible Moves:
Due to the bearish fractal, the subsequent direction to which Steem can go can go further down. However, this has to be done with other indicators.
RSI (Relative Strength Index):
The RSI is about 40 right now suggesting that Steem is not quite in oversold yet. If the RSI drops below the 30 level, it may mean a reversal and therefore could be a buying signal.
Moving Averages:
The upward sloping blue line also indicates that the 50-day moving average is above the 200 day moving average, which creates what is called a bearish “death cross.” This is in support of the bearish fractal pattern meaning that the downward trend may persist as we analyze below.
Conclusion:
Steem is for now in a bearish fractal cycle, which is backed up by a death cross in moving averages and an RSI that is slowly heading to oversold territory. If the RSI goes any lower, one might look for signs of turning around which might be signified by a lower RSI. However, on the same trend, it seems like things are going in a bearish direction till that point. The evaluation of these indicators will become a useful task to make more coherent trading decisions.


Thanks for reading my content. I am ending today's content here wishing everyone good health.
I invite you to support @pennsif.witness for growth across the whole platform through robust communication at all levels and targeted high-yield developments with the resources available.
 Click Here
 Thanks for reading the Post
02/0!/2024
Thanks to everyone here is an invitation @mostofajaman @simonnwigwe & @josepha
The End |
|---|

x promot link: https://x.com/Shahari73599011/status/1839667132130529315
Downvoting a post can decrease pending rewards and make it less visible. Common reasons:
Submit
Upvoted. Thank You for sending some of your rewards to @null. It will make Steem stronger.
Downvoting a post can decrease pending rewards and make it less visible. Common reasons:
Submit
please use the right main tag #cryptoacademy-s20w3
Downvoting a post can decrease pending rewards and make it less visible. Common reasons:
Submit
Done sir...!
Downvoting a post can decrease pending rewards and make it less visible. Common reasons:
Submit
My dear friend, welcome to this contest, you have presented the fractal cycle, bullish fractal and barys faculty in a very beautiful way. Gradually you learn to understand the candles indicators in a very beautiful way. I wish you all the best and I hope you will analyze more beautifully in the future. Best of luck.
Downvoting a post can decrease pending rewards and make it less visible. Common reasons:
Submit
Thanks for your nice words....!
Downvoting a post can decrease pending rewards and make it less visible. Common reasons:
Submit
Hi @shahariar1
You have a good entry in this contest while explain the fractals. You have demonstrated the bullish and bearish fractals on the chart.
We can see that general bullish fractal is formed it drives the price to move in the upward direction.
And similarly when a bearish fractals occur then the price movements in the downward direction.
So we can determine our entry and exit points with the help of the fractals because the patterns repeat and follow each other.
Best wishes for the contest.
Downvoting a post can decrease pending rewards and make it less visible. Common reasons:
Submit
Thank you very much for your valuable comments.
Downvoting a post can decrease pending rewards and make it less visible. Common reasons:
Submit
You are welcome 🤗
Downvoting a post can decrease pending rewards and make it less visible. Common reasons:
Submit