Contest Link 👇
SEC S18-W5 || Mastering Trading with Stochastics and Parabolic SAR . I invite some of the skilled users I know to participate in this contest. "Honorable Mentions:
@rashid001 @radjasalman @ripon0630
.png) |
|---|


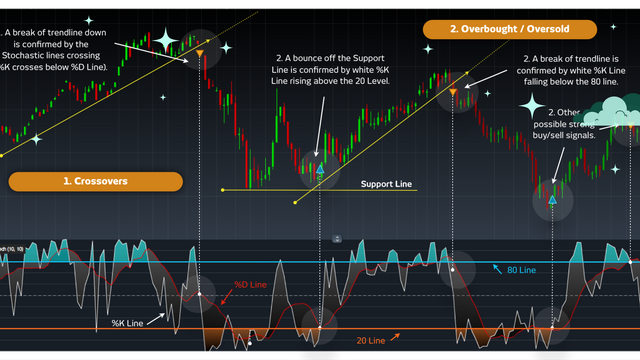
The stochastic Oscillator is a technical tool used to display the condition of over buying or selling on an over sold/oversold level. Here are the key components:Here are the key components:
%K Line: This line is the current closing position of the current price in relation to the highest and lowest price range over a specified number of periods (usually 14). It ranges from 0 to 100; connotations suggestive of oversold conditions pertaining to the instrument, signify low readings, whereas connotations suggestive of overbought conditions allude to the high readings.
%D Line: Like the %K line, the %D line is also the smoothed percentage line of the %K line. It assists in reducing inputs that are not needed and give a more pure signal. It is generally defined as the %K line in its MA formulation (often a 3-day SMA).
How it works:
A buyer’s market is indicated when the Stochastic Oscillator rises beyond 80 to signify that the asset previously rose too high and may be because of a reversal.
On the other hand, when it is below this level it gives the signal of an oversold price and as a result, there might be a possibility of an upward movement of the price.
It is thus wise to remember that there is no ‘best’ setting for every asset; the parameters might be at their best in one asset and at their worst in another. Nevertheless, the Stochastic Oscillator is still one of the best indicators applicable to mean reversion trading.
 |
|---|
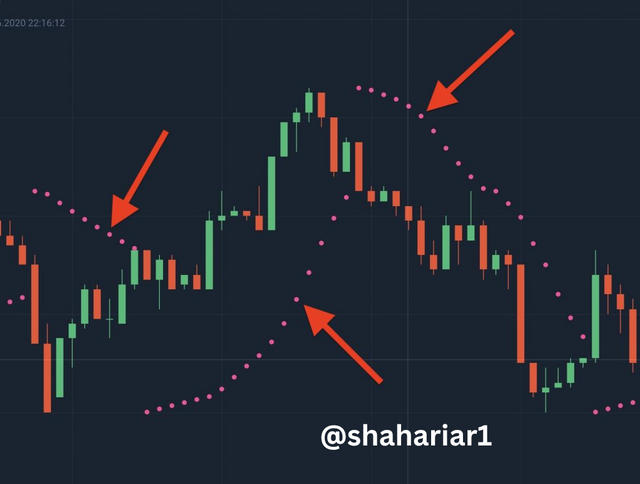
Parabolic SAR (Stop and Reverse) is another popular trend indicator created by J. Wells Wilder that looks really useful for making trend decisions and defining the reversal levels of prices. Let's break it down:
Indicator Basics:
Parabolic SAR is represented as a number of dots situated under the price chart.
It depicts an upward sloping direction (bullish) if the dots are positioned below the pricing line.
- On the other hand, when the dots are placed above the price it signals a downward movement, or the bearish signal.
Calculation:
The acceleration factor (AF) for the Parabolic SAR is initialized to 0. 02, and continues to rise, raising the possibility of rest breakdown if the increase is sustained at this rate. 02 (to the maximum level of 0. 2) each time the extreme point (EP) moves to lower levels in the case of falling SAR and vice versa in the case of rising SAR.
There are two formulas:- There are two formulas:
Rising PSAR (RPSAR): $$Hence, RPSAR = PSAR_Previous + AF_Previous \times \frac{EP-PSAR_Previous}{AF_Previous}$$
Falling PSAR (FPSAR): $$FPSAR = Prior\ PSAR - \left [ Prior\ AF \times \left (Prior\ PSAR - Prior\ EP \right ) \right ]$$
Application:
Trend Identification: Another useful tool for moving above/below the price level is the Parabolic SAR that helps determine the current trend direction.
Reversals: The main idea about the dots is that when they change their position from one side of the price to the opposite side, then it formulates a change of direction.
Note: A swing from an upper or lower SAR does not suggest an immediate reversal of price; this only implies that the price and the indicator have converging lines.
Interpretation:
Uptrend:
Bullish indications are over dots below the price.
An upswing from below the price may indicate a switch towards up from below the particular price line might indicate a change of trend towards an upward reversal.
Downtrend:
If dots are placed above the price, this indicates the bearish momentum of the market.
Basically, when there is a switch from above the price to below the price, then it might mean that there is a change of trends and that the uptrend might be reversing.
Trend traders will find the Parabolic SAR uniquely effective since it flag actual opportunities for buying and selling. They were so engrossed in what they were doing that Jackie had the sensation of having to watch out for those dots!
 |
|---|

When Stochastic Oscillator and Parabolic SAR are used together, they may complement each other and form an effective trading system. Let's dive into the details:Let's dive into the details:
Stochastic Oscillator:
The Stochastic Oscillator assists in assessing the impending market event and define zones of overbought and oversold.
**It consists of two lines:But the expedition fell short just like the previous and Creek Indians fight as well as their propaganda techniques and nicknames.
- %K Line: Expresses the position of the current within the closing prices high low range over some time period (often, 14 days).
- %D Line: A smoothed version of %K, which could be the %K of the preceding day or period, such as a three-day moving average.
Interpretation:
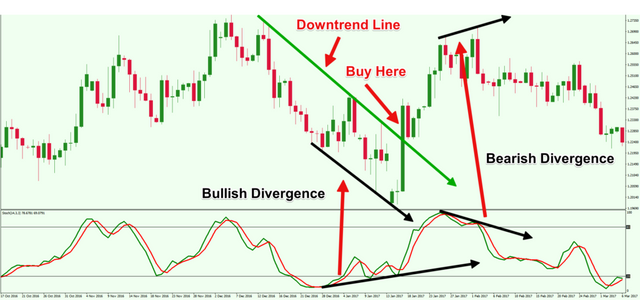
The %K impact of an increasing %K value above the 20 level and below the 50 level is bullish .
And as %K declines from the overbought level at 80 to 50, then it is bearish.
Parabolic SAR:
- Large price bar open, close, high, or low values marked by the Parabolic SAR signal potential reversals, and price direction.
- It appears as dots on the price chart:- It appears as dots on the price chart:
- Below price: The given patterns can be classified as an uptrend or bullish pattern.
- Above price: Bearish or downtrend refers to a security, index or a stock market that is under bear control and is in a downward trend.
- Modified settings for quicker signals:- Modified settings for quicker signals:
- Step: 0.05
- Max AF: 0.5
Strategy:
Long Entry:
Conditions:
- Holding stochastic %K at a level between 20 and 50.
- To achieve for %K greater than %D, one must follow the below provided guidelines of the case study.
- Increasing Stochastic trend.
- SAR has issued a crossover of PARABOLIC to the bullish side in the last 5 bars.
Entry:
- If it is bullish, open long trade at the next candle open after the reappearance of the candlestick pattern.
Stop Loss:
- Stop loss should be placed just below the graph swing low or 2% below the market price at the time.
- Naturally it is good practice to trail the stop loss with the market.
Do not forget to consider market conditions and to follow the indicators included by some of the above-mentioned analysts. Happy trading!
 |
|---|

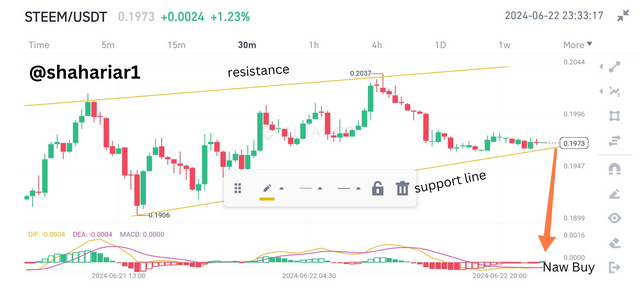
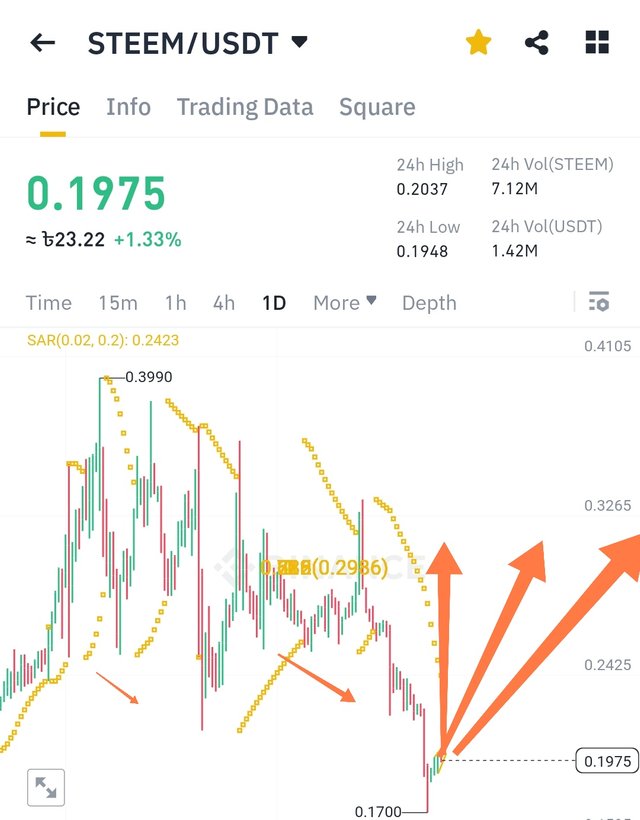
Let’s analyze the situation below and then I would like to describe you how you might analyze it with the help of the Stochastic Oscillator and the Parabolic SAR.
Trading Decision:
- Say, in the history of the STEEM/USDT pair, the Stochastic Oscillator has touched the level below 20 that could suggest the market is oversold.
- At the same time, the PARabolic SAR stays green, indicating that the uptrend is still intact.
- Here's how you might approach this:- Here's how you might approach this:
- **Scenario A (Bullish Bias):They are; Engage customers faster and in a more effective way than their competitors; Gain insights into customers’ behaviors quicker than their competitors; Obtain new customers at a lower cost compared to their competitors; Retain current customers better than their competitors; Use more flexible compensation models compared to their competitors.
- While using the current Stochastic Oscillator in this way looks attractive due to the oversold status, some regard this as a buying signal.
- This can be done through checking other pure technical indicators such as moving averages, support and resistance levels.
- If further confirmation is consistent with the entry, you may go long/ purchase the currency pair.
- **Scenario B (Cautious Approach):However, especially in the case of English learners, the inability to engage fluen tly in informal conversation may occur.
- While it is true that overselling is admitted in some cases, some precaution is still necessary.
- Await a confirmation signal so as to reconfirm either a buy signal or a sell signal such as when the Stochastic Oscillator crosses above the 20 or when Parabolic SAR shifts color.
- As mentioned, one should only enter a long position when all the other signals are positive.
However, as has been stated earlier, there is no definitive signal that points to the success of any particular strategy without employing risk management practices and concepts, as well as taking into consideration the dynamics of the foreign exchange market. Also, it is crucial to comprehend that historical data is not a reliable way of determining future performance; thus, if you are in the process of charting your streamer’s growth, it is also important to consider the current market conditions.
 |
|---|

Let's analyze the STEEM/USDT pair using the Stochastic Oscillator and Parabolic SAR:Let's analyze the STEEM/USDT pair using the Stochastic Oscillator and Parabolic SAR:
Analysis:
- Going to the current positions of the STEEM/USDT, evaluate the current stochastics oscillator and the current parabolic SAR indicators.
- When the Stochastic Oscillator is below 20 (oversold) and the Parabolic SAR remains green in color, this has to be interpreted as a bullish signal perhaps for a buy entry.
- Check it with other kind of indicators such as moving average, signal of support resistance.
- It is better to be careful for further signal before going long end.
The key point to recall here is that there are no infallible signals, and timing is critical to be effective. There are always ways to reduce risk and if there are obstacles to changing, then they should always be worked around.
 |
|---|

I invite you to support @pennsif.witness for growth across the whole platform through robust communication at all levels and targeted high-yield developments with the resources available.
 Click Here
 Thanks for reading the Post
23/06/2024
The End |
|---|

X promote link : https://x.com/Shahari73599011/status/1804578157322015130
Downvoting a post can decrease pending rewards and make it less visible. Common reasons:
Submit
Upvoted. Thank You for sending some of your rewards to @null. It will make Steem stronger.
Downvoting a post can decrease pending rewards and make it less visible. Common reasons:
Submit
!upvote 15
💯⚜2️⃣0️⃣2️⃣4️⃣ Participate in the "Seven Network" Community2️⃣0️⃣2️⃣4️⃣ ⚜💯.
This post was manually selected to be voted on by "Seven Network Project". (Manual Curation of Steem Seven).
Downvoting a post can decrease pending rewards and make it less visible. Common reasons:
Submit
the post has been upvoted successfully! Remaining bandwidth: 80%
Downvoting a post can decrease pending rewards and make it less visible. Common reasons:
Submit
Your post has been rewarded by the Seven Team.
Support partner witnesses
We are the hope!
Downvoting a post can decrease pending rewards and make it less visible. Common reasons:
Submit
Stochastic and Parabolic SAR are two indicators that are very famous in trading circles, especially the functions and benefits shown by these two indicators.
This indicator also makes it very easy for traders to analyze the direction of market trends.
You are absolutely right friend, accuracy, emotion, and also understanding the science of trading is very important...
Nice to read your publication, good luck with this theme friend...
👍👍👍
Downvoting a post can decrease pending rewards and make it less visible. Common reasons:
Submit
Unfortunately @shahariar1, given the structural and content overlap between the responses generated by Chatgpt and your post, the similarity percentage is around 85%. Both answers cover the same technical analysis concepts with slight variations in wording and depth of explanations.
For this reason, your post will be considered invalid.
Total| 0/10
Downvoting a post can decrease pending rewards and make it less visible. Common reasons:
Submit
Sir please let me know which tools you are using for AI test. Since there was consistency between the questions, there is some consistency in the answers. I made some corrections. I will be disappointed if you rate even a littl. I think it can be considered.
Downvoting a post can decrease pending rewards and make it less visible. Common reasons:
Submit
The tools are not a reliable source for us to confirm the absence of artificial intelligence in your post. We are humans and we can determine the similarity between two answers, whether in their structure or in the ideas presented to them. Therefore, we took into account that your post contains plagiarism.
Downvoting a post can decrease pending rewards and make it less visible. Common reasons:
Submit
Yes I admit it. But I definitely didn't steal it and install it First I took the idea and later tried to write it. Well I will try better later.
Downvoting a post can decrease pending rewards and make it less visible. Common reasons:
Submit