|
|---|
Hope you all are doing well and good and enjoying the best days of your life. This is me @shahid2030 from Pakistan and you are here reading my post. You all are welcome here from the core of my heart.
This is my participation in a contest Advanced Trading: Multi-Timeframe Analysis and Market Cycles organized in SteemitCryptoAcademy by @crypto-academy .
Question 1: Understanding Market Cycles. Explain the four key phases of market cycles (accumulation, expansion, distribution, and contraction) and their significance in cryptocurrency trading. |
|---|
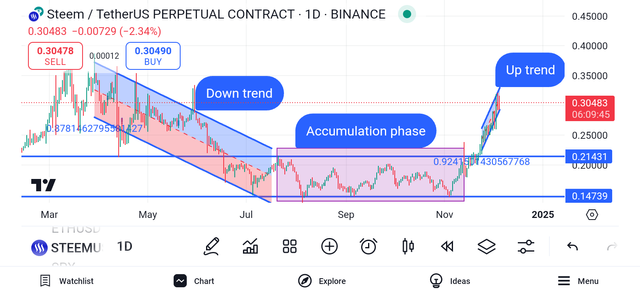
The market cycles usually consist of four key phases: accumulation, expansion, distribution, and contraction. These are the essential phase for understanding market trends and making informed and right decisions in cryptocurrency trading. Here's a breakdown of each phase:
1. Accumulation Phase
Definition: Here the market is less volatile and it shows low volatility, and the prices stabilize after a prolonged decline. The market come through the phase when asset prices are undervalued, and sentiment is bearish or neutral.
Key Players: Institutional investors, smart money, and long-term holders, they are the players to this phase. They often buy during this phase, accumulating assets at low prices at the bottom of the market.
Significance: It signals the bottom of the market, a high time to grab the opportunity for early entry before a potential uptrend.
2. Expansion Phase
Definition: The market enters to an uptrend, marked by increasing demand and we see a rise in prices. Positive sentiment from the investors and their growing interest drive this phase.
Key Characteristics: High trading volumes, and we see higher highs and higher lows in price, and here is the entry of retail investors.
Significance: This phase we called the most profitable one for traders, as prices experience significant upward momentum.
3. Distribution Phase
Definition: The market reaches to a prime position we called peak, and prices stabilize or we see a sideway move here as supply and demand reach equilibrium. Traders' sentiment shifts from overly optimistic to cautious.
Key Characteristics: We see high volatility, reduced buying interest, and their is significant selling by early investors or institutions.
Significance: It is the top of the market. Remember it's too much risky point and risk increases for new buyers. Expert traders often take profits in this phase.
4. Contraction Phase
Definition: The market enters a downtrend after a long uptrend as selling pressure increases and prices start getting decline. This phase is usually dominate by negative sentiment.
Key Characteristics: Market makes lower lows and lower highs in price. We see reduced trading volumes, and panic selling.
Significance: This is the period of losses for many investors. However, this phase sets the stage for the next accumulation phase, where prices stabilize at lower levels.
Question 2: Applying Multi-Timeframe Analysis. Demonstrate how multi-timeframe analysis can be used to identify trends and reversals during different market cycle phases. Use examples from Steem/USDT charts. |
|---|
Multi-Timeframe Analysis (MTA) is the analysis of the same asset across different time frames to gain a comprehensive and better understanding of market trend and potential reversal points. This approach is mainly effective in analysing and understanding market cycles (accumulation, uptrend, distribution, and downtrend), because different time frames highlight various aspects of price action.
How Multi-Timeframe Analysis Works
Higher time frame identifies the broader trend or market phases. We use daily or weekly chart for it. Medium Timeframe Tracks intermediate trends and corrections in the market. We use 4-hour or 1-hour chart for it. Last one is
Lower Timeframe, which Pinpoints precise entry and exit points. We use 15-minute or 5-minute chart for it.
Weekly Chart of STEEM/USDT.
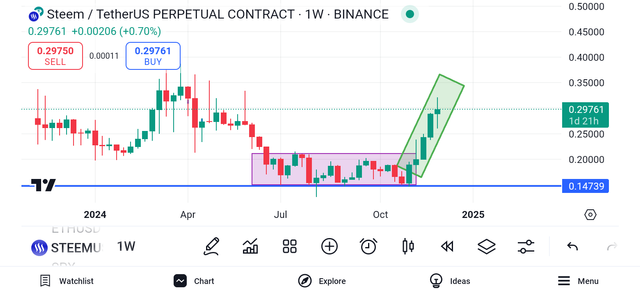
This is the weekly Chart of STEEM/USDT showing us the accumulation phase and uptrend phase. Let me enter to the current uptrend phase, use different time frames to find out market trends and movements.
Daily time frame.
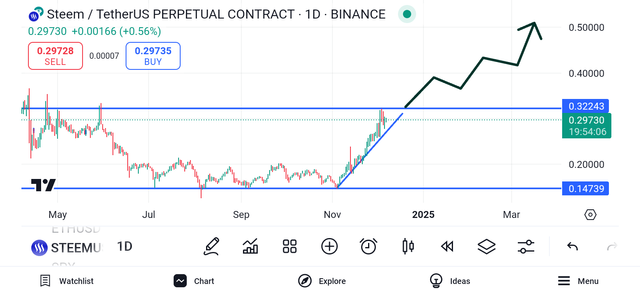
On daily time frame we are in sharp uptrend. The market is making higher highs and higher Lowes. We have a strong resistance levels at 0.3224, market respeced at many times. If the market break it in upside and give a one day candle closing above, we can see a sharp upside movement in Steem's price.
4 hours time frame.
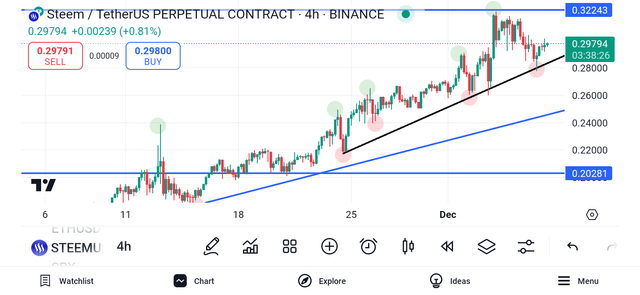
On four hours we are also in uptrend. The inner trend is up to making higher highs and higher Lowes. On four hour time frame our support is 0.2028 and the resistance is same at 0.3224
1 hour time frame.
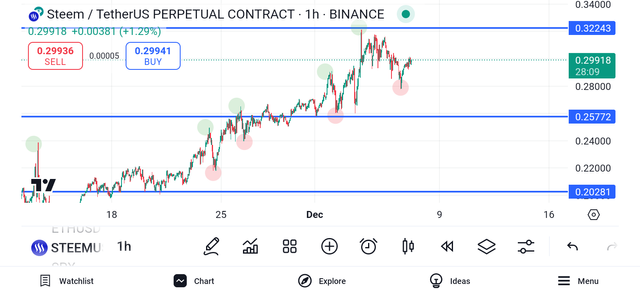
On one hour our market is still in uptrend and it gives us a more better understanding of the market. It gives us a more clearer insight to the market. On one hour time frame we have another important support level at *0.2577. Unless the price is above it we can find an opportunity for long position.
15 minutes time frame.
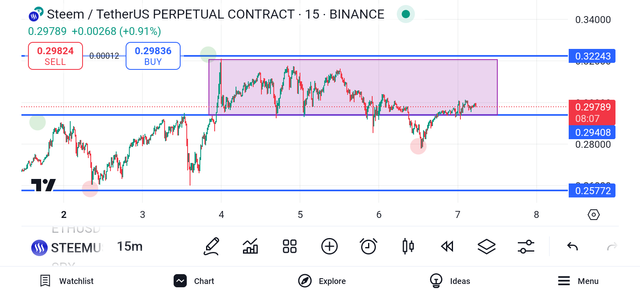
On 15 minutes the market is an consolidation. It is not making any higher highs and higher Lowes or lower highs and lower Lowes. Our support level here is 0.2940 which the market has broken in downward direction, but it was a fake breakout, because it failed after the retest. Until the price is above our support level we are in uptrend.
One thing is very much clear that we are currently in uptrend. All time frames shows that we are in a clear uptrend. Now we have to look for a long position. For example if we find out the market at support level we must should go for long. And if the price break our support in downward direction, which gives us best entry for short we should avoid it. The reason is we shouldn't go against the trend. Sometime on daily or 4 hours time frame we are in uptrend, but smaller time frames like 15 minutes or 5 minutes give us downtrend, so in such scenario we should avoid short position. We should always focus the major trend.
Question 3: Combining Market Cycles with Multi-Timeframe Analysis. Show how to align multi-timeframe analysis with market cycles to refine your trading strategies. Highlight how these tools complement each other in volatile markets. |
|---|
Market cycles and multi-timeframe analysis, both are the powerful tools traders use for refining trading strategies. When used together, they help traders better to understand the market behavior, also helps to identify high-probability trade setups, and mitigate risks in volatile markets.
One day STEEM/USDT chart.

This is a one day chart of STEEM/USDT. I have pointed out 3 phases here; a down trend which had taken market to it's dip. We can see the price went from $0.4 to $0.14 level. Their is then the accumulation stage which had lasted for many months, and now the last one is trend reversal. Currently a downtrend has been over and we have entered to an uptrend now. This is the money making phase for traders.
4 Hours STEEM/USDT chart.
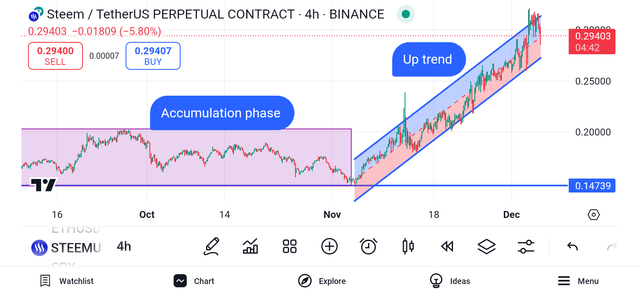
This is a 4 hours chart of STEEM/USDT. Here we have long accumulation phase, followed by an uptrend. Currently STEEM'S price is trading at $0.2946 level, it's in uptrend making higher highs and higher Lowes. We see our support at $0.2759.
1 Hours STEEM/USDT chart.
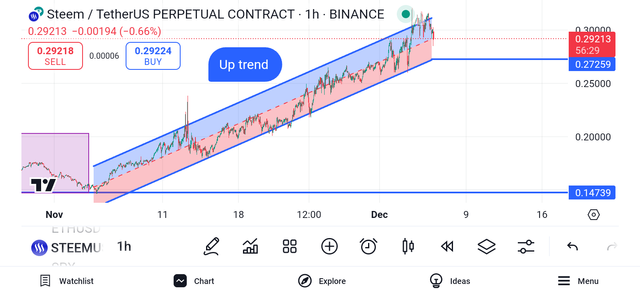
Let's zoom out the uptrend using one hour time frame.
In these below Charts we see market making higher highs and higher Lowes. The middle average line is the important zone which works as a support and sometimes resistance. It has been respected multiple times.
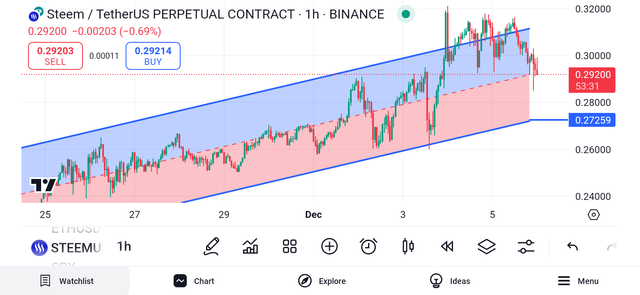 | 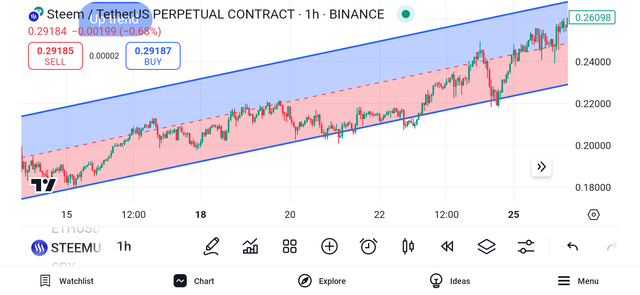 | 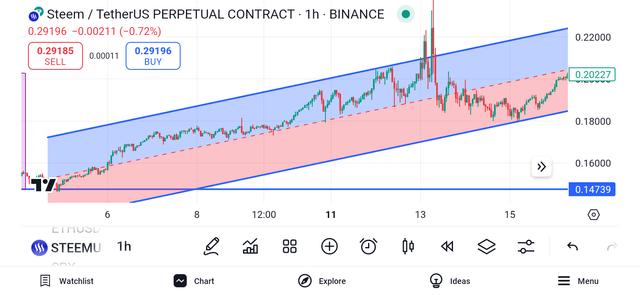 |
|---|
Question 4: Developing an Advanced Trading Strategy. Create a trading strategy for Steem/USDT that integrates market cycle phases and multi-timeframe analysis. Specify your entry, exit, and risk management criteria. |
|---|
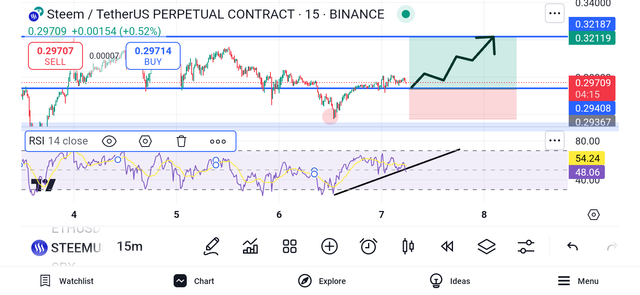
I believe support and resistance are the best tools we can trade on. Let me show the current situation of the market on 15 minutes time frame. We can go for a long position from here. Our entry point could be 0.2940 and exit point should be the strong resistance level 0.3218. RSI is at 47 level which is at normal position, but it is in uptrend too.
Risk Management our trade is valid for long position because it has taken a retest at this support level (0.2940). Our trade is of 1:1.72, it's almost 1:2.
1 hour time frame.
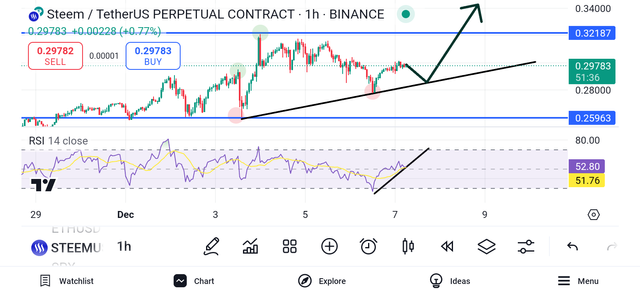
On one hour time frame we are in uptrend, but not at situation of getting entry now for any position. If the market touch our trend line (support) we can think of long position, but keep in mind our target should be below 0.3218, because it's the strongest resistance we have. The market may get rejection from here.
Risk Management our trade should be at least 1:1. Try to look for more confirmation too along with RSI and trend line.
Question 5: Mitigating Risks in a Volatile Market. Discuss how to manage risks and avoid false signals when trading across multiple timeframes during different market cycle phases. |
|---|
According to my analysis in bullish market always try to use higher time frame. The reason is because higher time frame give us the accurate and perfect trend. Yes for position confirmation we should use smaller time frame. The support and resistance made on higher time frame are more strong and authentic compared to smaller one. Even I sometimes use weekly time frame to find the strongest support and resistance levels.
I believe one day time frame give more confirmation than 4 hours time frame. Similarly 4 hours time frame gives more confirmation than 1 hour and 1 hour is better than 30 minutes or 15 minutes. The reason is the smaller the time frame the more volatile market we have, this is the reason too many important levels are not respected by the market.
However, every time frame has it's own job. Larger time frames (weekly or daily) are used for long term trading or holding. Mid time frames (daily & 4 hours) are used for are used for medium trading and short time frames (30,15 & 5 minutes) are used for day trading or sometime scalping.
My trading strategy
I look for a chart on longer time frame. Find out it's trend whether it's in uptrend or down trend. I always respect the trend. For example, if the market is in uptrend I try to find long position in it and if it's in down trend I find short trade for my self. I never go for long in down trend and short in uptrend.
Another thing which is included in my strategy is waiting for the perfect retest. It always helps you safe from the fake breakout or market manipulation.
how to manage risks and avoid false signals when trading across multiple timeframes during different market cycle phases?
- Always follow the trend and never go against the trend.
- If using higher time frame must use smaller time frame for perfect entery point.
- Wait for the perfect retest after any breakout.
- A least 3 to 4 confirmation should be there for taking any trade.
- Use fundamentals news along with technical analysis.
This is all about my blog for today, hope you guys have enjoyed reading it. See you soon with a new amazing and interesting topic, till take care.

| I would like to invite: @goodybest, @ripon0630, @beemengine, @tommyl33 to participate in this Contest |
|---|
Your presence here means alot
Thanks for being here
Regard shahid2030

