Hi to all my steemian fellows . I am also fine . Its my pleasure to participate in this class . My name is @shahzadprincejee and one of your students . I want to say thank you to respected professor @asaj for this interesting lecture . You are so intelligent sir . This is my submission for you. Let's get started the explanation about the Vortex indicator Strategy without wasting time .
QUESTION 1
• In Your Own Words Explain The vortex Indicator and How It is Calculated
In economic trading, one of the most important thing traders always use to divine price motion is technical analysis . And the technical analysis is from the use of candlesticks on charts and many other technical indicators. Therefore, the vortex indicator is one of the important technical indicators which are used by many of traders and investors . Now , we will explain in detail that what is Vortex Indecator .
Vortex Indicator
The vortex indicator was introduced 10 years ago, to be precises 2010 in 2010, Etienne Boots and Douglas Siepman were the two men . A vortex indicator is a kind of indicator that traders use to modify direction or predict price's motion . Generally , the vortex indicator is a trend indicator. It is a trend indicator that identifies a rowback of the trend, launches a new trend and the continuation of the current trend depends on the general bias of the market in a particular period.
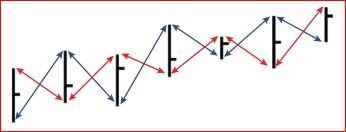
The vortex indicator consists of two lines as can be seen in above image . 1. The blue line is called as the positive vortex indicator (VI +) , while the red line is often called the negative vortex indicator (VI–) . These lines often rood a sure patch of time.
In addition , when the red line crosses the blue line and goes up, it means that the seller or the bear has got power . They have subdued the buyers and now they can bring down the market price.
According to this indicator, the trend can be described as positive and negative. The gap between instantaneous high and lower than before is often referred to as a positive trend, while the distance between the instantaneous lower and the last lower is called the negative trend.
How Vortex Indicator is Calculated
There are three things or specifications in the calculation of the vortex indicator . They are trends, periods and limits.
TREND: It is the upward and downward motion of the trend is planned . The upward movement is calculated by subtracting the previous lower from the current height [cH - pL] or (cH=current High ) . And the downward motion is planned by removing the preceding high from the present minimum [cL - pH] or ( cL= current Low) .
PERIODS: When using the term, it is recommended to choose 14 as it is stated that this session is trustable and give the correct result . However, depending on one's scheme , you can choose any session from which you are chill. It doesn't matter what you select , the important thing is the outcome which you are gaining . The duration chosen will often regulate the up and down readings of the up and down motions .
RANGE: The real limit is calculated, and the maximum of them is calculated by choosing:
cH – cL
cL – pC
cH – pC
Where:
cH = current High
cL = current Low
pC = previous Close
QUESTION 2
• Is the vortex indicator reliable? Explain
This trend is true when looking for reversals and confirms current trends using a pair of running lines . However, VI signals can't be very correct when using short-term settings. But when using long-term settings, the signals are really very correct .
With vortex when the session is longer it decreases the chances of a fast rend reversal. However, when the session is shortened, it gives a lot of crossover points and some turnout is fake.
In crypto trading we cannot completely explain that an indicator is 100% it will take some time to completely to know and predict the weather. This indicator is probably correct. But using Vortex Indicator along with other gadgets will help you save a good trend.
If entrepreneurs have not achieved any level of psychology, no matter how practical the device may be, it will still fail. Psychology is one of the most important things in business. Trade is about emotions and if one cannot control one's emotions then it is not suitable for trade.
However, there are those who have not learned to manage their funds . If a trader does not know how to supervise his fund. Even if he wins 8 out of 12 trades, he can still lose everything he has. Fund management is very important as well as business management.
QUESTION 3
• How is the vortex indicator added to a chart and what are the recommended parameters? (Screenshot required)
Most of people use for analysis is trading view , so that i also will using this platform for this lesson's question.
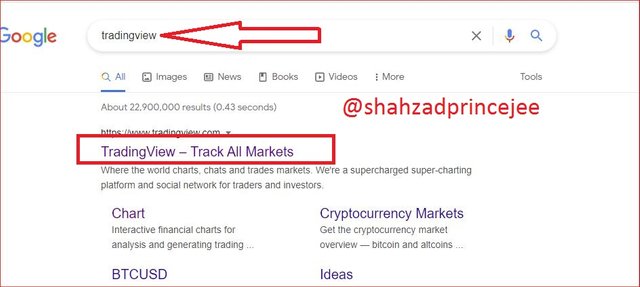
First of all, we choose the Google browser and search the tradingview.com on the search box .
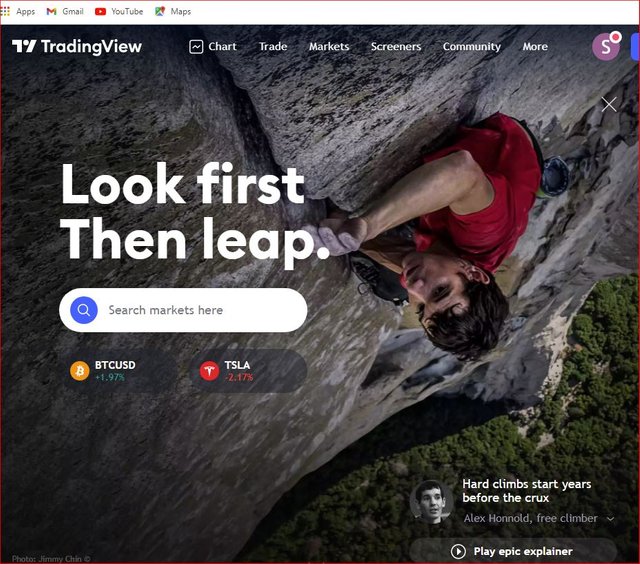
Now we should be select the chart option .
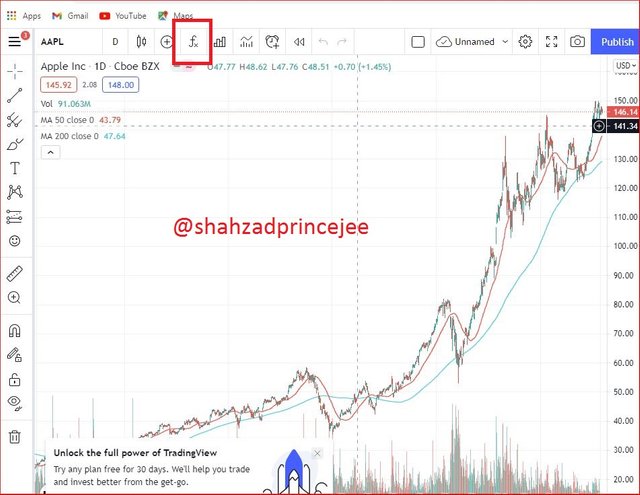
Now click on the Indicators.
After clicking on the Indicators a popup will be open on the display and we search the vortex only and many of options will be views to our eyes . We just click on the Vortex Indicators.
By clicking that now we are sure that the vortex indicators will be added . We can see that two lines are intersecting with each other .
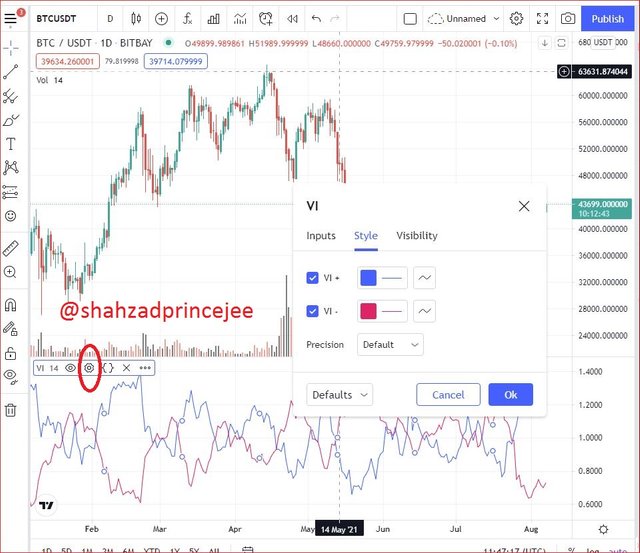
Now we will click on the chart to know some features of this chart . We will find out the setting button and clik on it .
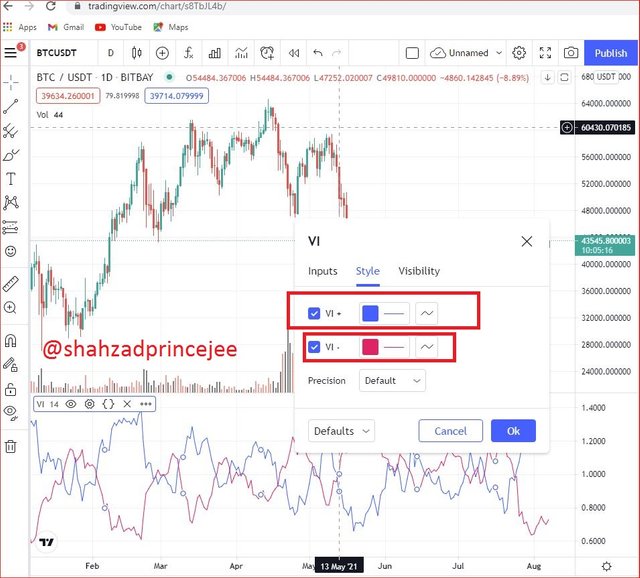
As we can see all incons , and the different icons have own different working such as eyes icon will work for hide something and the "x" icon close the vortex indicator chart and so on others . We click only on the setting and input the length and change the style , we put the V+ of colour blue and V- of colour red .
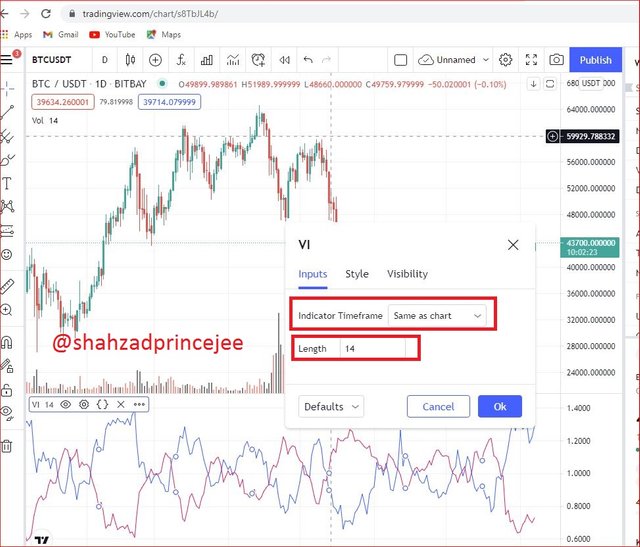
Now we click on the input and set the length . Indicator time frame set as "same as chart " . Now we see the screenshot below.
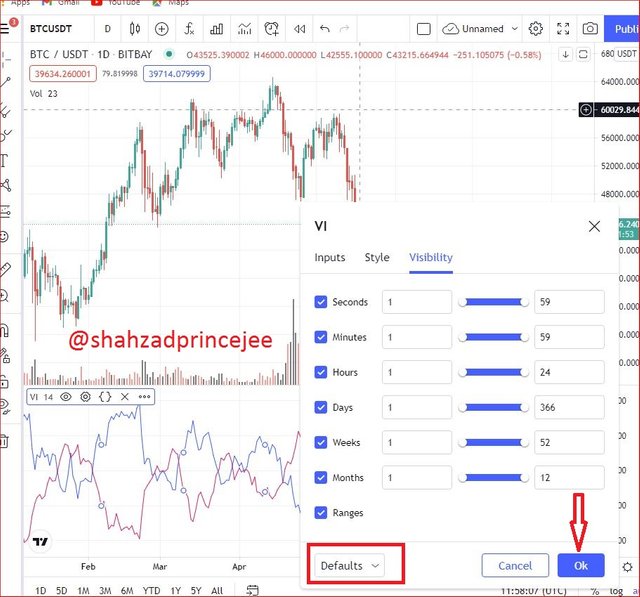
Next we go on the visibility section and set it as a default , we only click on the OK .
QUESTION 4
• Explain in your own words the concept of vortex indicator divergence with examples. (Screenshot required)
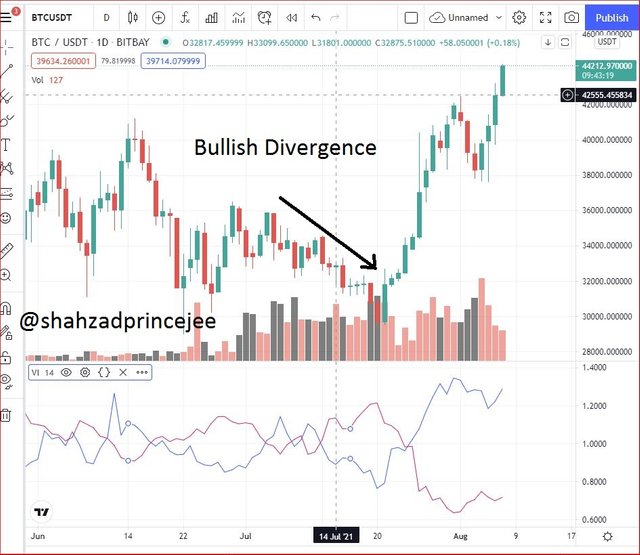
Divergence is two kinds of when considering vortex indicators . First of all, we will explain the bullish divergence .
Bullish Divergence
Blush divergence occurs when the VI + trend line, the blue line, moves higher while the chart price movement moves lower. It is seen as a buying signal for traders.
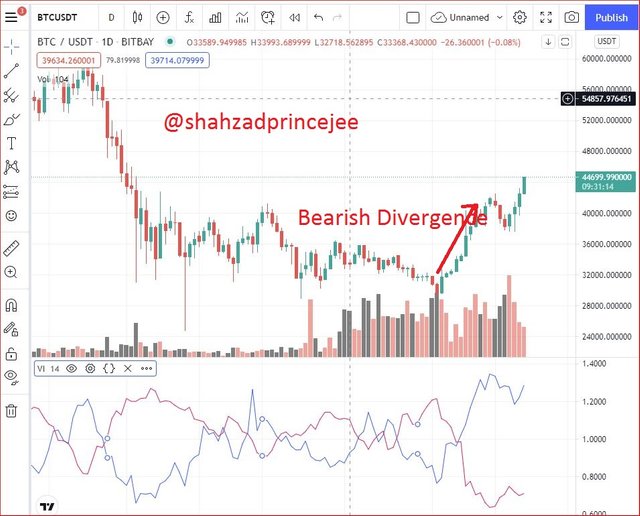
Bearish Divergence
Bearish divergence occurs when the VI-trend line is the blue line. Moves to lower heights while chart price movement breaks previous heights or you could say . If the price movement moves up for a moment and then moves down, it sells signals to traders.
QUESTION 5
• Use the signals of VI to buy and sell any two cryptocurrencies. (Screenshot required)
Buy Set Up on BTCUSD
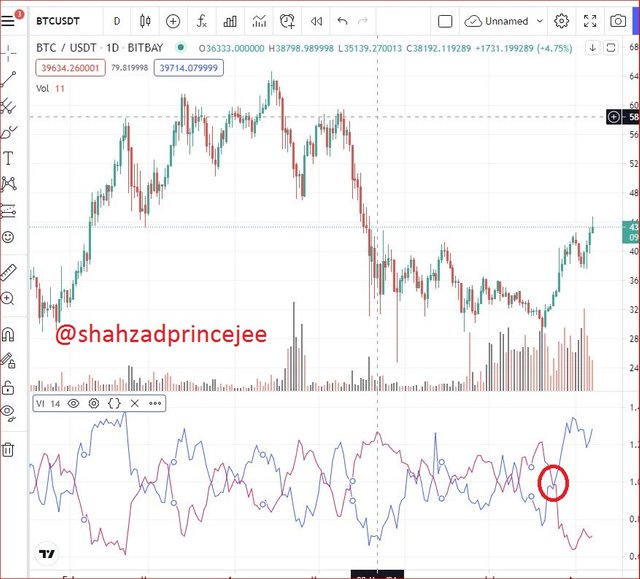
For this question , first of all we will use the BTC/USD chart . I will opened the chart and the reversal was spotted on BTC/USD . Let's see the screenshot in the below image .
As you can see in the screenshot above , the positive VI trend line (blue) has crossed the negative VI trend line (red) from the bottom . And it indicates the purchase order. So I placed a purchase order on the ETH / USD chart .
Sell set Up on ETHUSD
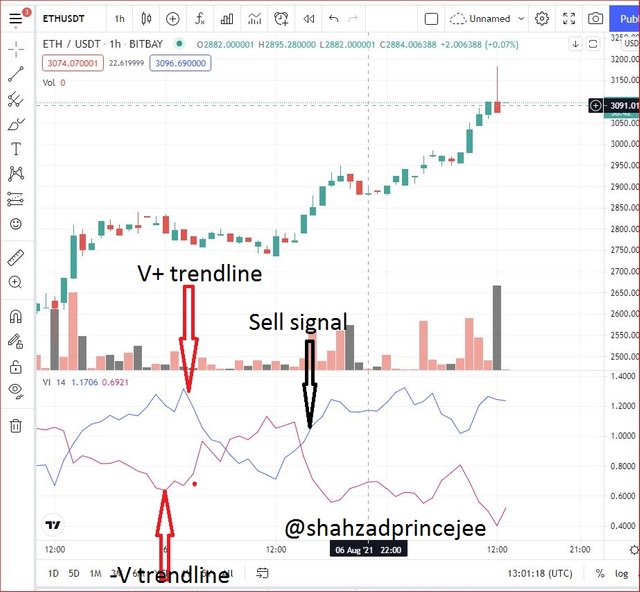
ETHUSD has been trending up for some time with advanced series . The vortex indicator indicates a sell. The blue line is VI + the red line crosses -VI and goes down. It is further confirmed that this trend could be reversed at this juncture. With the green line and the positive vortex indicator VI + lower, the price moves higher.
As you can see in the screenshot above, the negative VI trend line (red) crossed the positive VI trend line (blue) from below. And it indicates the sell order.
conclusion
It was really interesting and amazing lesson , I have a lot of things from this lesson which i did not know before this . I knew from this lesson that the vortex indicator also use for the technical analysis of out asset which we have choosen.
This indicator consists of two oscilators such as +V and -V . which helps to the traders for the starting of a new trend and also existing trend in the market . It is really very trustable tool for the traders and investors .
So i am grateful to respected professor @asaj for this educative lecture . Thanks again professor .
Cc .
Best Regards




This content appears to be plagiarised as indicated by @asaj
If you have not already done so, you should head to the newcomers community and complete the newcomer achievement programme. Not only will you earn money through upvotes, you will learn about content etiquette;
Notification to community administrators and moderators:
@steemcurator01 ADMIN
@sapwood MOD Professor[Advanced]
@steemcurator02 MOD
Downvoting a post can decrease pending rewards and make it less visible. Common reasons:
Submit