I was able to learn a lot from the last lesson. I hope I can accurately highlight what I have learned from this lesson in this post. It is very important for a trader to understand the market properly. In order to trade a prop, it is important to keep an eye on the market, to know about the market by looking at the market chart.
What Is A Chart Pattern?
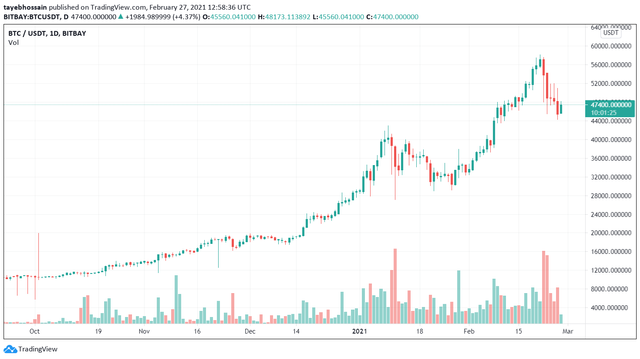
The chart pattern is basically the price structure. Where the price is always moving, specify this movement, and predict the price accordingly. When we want to buy a coin, we have to do technical analysis on the chart of that coin based on the previous price action. Chart patterns include trends, which are higher high, lower low lower, there are more such as, 1-hour chart, 2-hour chart, 1-day chart, This means that new candles are made one at a time. If one day chart, make one new candle every day, it can be bullish or bearish.

If you look at the screenshot above, you can see that the price is moving. This is a day chart pattern. Where green candle sticks are bought, and red candle sticks are sold. And we understand that the market is bullish or bearish.
What Is A Price Breakout?

Price breakout is an exciting moment for traders. When the price reaches the resistance zone and bounces from there, moving in the opposite direction and creating an uptrend, it is called a price breakout. We occasionally see a lot of crypto charts when resistance breaks and makes higher high. Price does not cross the support level. And when it breaks it continues uptrend or downtrend.
What Is A Continuation Pattern?
The continuation pattern is when the price moves in a certain direction in the crypto market. It can move in an uptrend or downtrend, no matter where it moves, it is a continuation pattern. After the breakout price may can go two ways.
What Is A Higher High Formation?
Higher-high formation is when the market points higher. It tends to go from higher to high. And breaks the previous high.

As you can see in the screenshot above, "A" was a high, and it went higher and made another high than previous one.
Lower Low Formation.
Lower low formation is the opposite of higher high formation. The price of a particular asset moves downwards, which is a downtrend and continues with that downtrend. And makes lower prices than previous low prices.

As you can see in the screenshot above, A was lower, and B formed more low and C formed lower than the previous low.
A Reversal Pattern:
The reversal pattern is a state of the market where the market trend changes direction. This is almost the opposite of continuity. Suppose a trend means an uptrend in the market, then it will change direction and create a downtrend. And when the chart makes a double bottom it indicates it is preparing itself to go up. And it keeps moving in the uptrend.
What is a Double Top Pattern?
In the double pattern we see two high side by side. Down in the middle. These positions indicate that the direction of the market will change and reverse. This means indicating a downtrend. A double top pattern forms two rounding tops.

In the chart above, you can see the step downtrend after the double top formed.The market is reversing and pointing from uptrend to downtrend.
What is a Double Bottom Pattern?
The double bottom pattern is a chart pattern of technical analysis that explains the trend direction change. After forming two trends in the market chart, it indicates an uptrend. Double bottom looks like W. The double bottom is highly effective when trading when the chart is properly analyzed.

Importance of STOPLOSS
A professional trader knows how important stop-loss is in trading. Stop-loss prevents large amount loss when the market is very volatile. Trading in the volatile market is just a matter of time before your position gets out of control.It plays an important role in risk management.Stop-loss prevents a trader from losing money invested. It is a trading strategy where the trader does not have to monitor his position all the time. If he sets the stop-loss, the trade will automatically close when you face a loss.
Where To Find & How To Set A Stoploss?

Setting stop-loss is important during trading. But it is more important to set the stop-loss correctly. In the chart above, A, B, C, D are good points, where we can set stop-loss. If I go to buy, C to B, then I have to set stop-loss at C.
In trading I am always careful with my capital. I value non-loss more than profit. When I receive an entry in a trade, I review the chart very well and then I take the entry. From this course I got confidence in trading. The biggest problem in my trading was the “patience problem”. I am able to fix it gradually from these courses.
All screenshots taken by me from my Trading View Account
Hi @shajj
Thank you for joining Steemit Crypto Academy and participated in the Homework Task 3.
Your Homework task 3 verification has been done by @Stream4u.
Thank You.
@stream4u
Crypto Professors : Steemit Crypto Academy
Downvoting a post can decrease pending rewards and make it less visible. Common reasons:
Submit
Thank you so much sir and I will remember your suggestion
Downvoting a post can decrease pending rewards and make it less visible. Common reasons:
Submit