I'm reposting this Trading post as it was not curated. Here is the previous post.

Cover Image - https://www.canva.com/

QUESTION :-
1.- Explain in detail the advantages of locating supports and resistances on a chart before trading.
2.- Explain in your own words the breakout of supports and resistances, show screenshots for the breaking of a resistance, use another indicator as a filter.
3.- Show and explain the breakage of a support, use an additional indicator as a filter, show screenshots.
4.- Explain that it is a false break and how to avoid operating at that time. Show screenshots.
5.- On a demo account, execute a trade when there is a resistance break, do your analysis. Screenshots required.
6.- On a demo account, run a trade when there is a breakout of the support, do your analysis. Screenshots required.


This is the Source of above image.
👉For Placing our Stop-Loss correctly
- In Trading Setup, it is very important to manage our risk in a reasonable manner. Therefore, we need to find a stop loss level to set our Stop-loss point in any Buy or Sell order. So, we can use these support and resistance levels to set our Stop-Loss point as many times price trends to reject from those levels and if it rejects, the movement can be continued.
👉For Placing our Target Point correctly
- Identifying a suitable exit point or profit-taking point is an important factor in every Crypto trade. Because finding a suitable reward-taking point is a bit complicated process as compared to the risk management process. So, we can easily use these support and resistance levels to Target point or exit point as many times price trends to reject from those levels and if it tends to reject from those levels, we can easily exit from the market.
👉To combine with Other Indicators as Trading setup
- At present, we have a lot of useful indicators to Trade Cryptocurrencies very easily. However, we can't use most of these indicators as stand-alone indicators as they can produce fake signals, especially on support and resistance levels. During those situations, we can try to highlight suitable support and resistance zones in our chart before taking the entry using our indicators. Then the accuracy of our Trade entry will be increased as compared to the previous single indicator Trading setup.
👉To do scalp Trading in a safe manner
- Scalp Trading is a popular and highly profitable trading method among Futures Traders (Leverage Traders). In a scalp Trade, we have to take our entries quickly and as well as exit quickly. So, we can use these support and resistance levels to find suitable entries or exit points very quickly using lower time frames such as 5m or 15m charts.

👉Explanation of Breaking Support
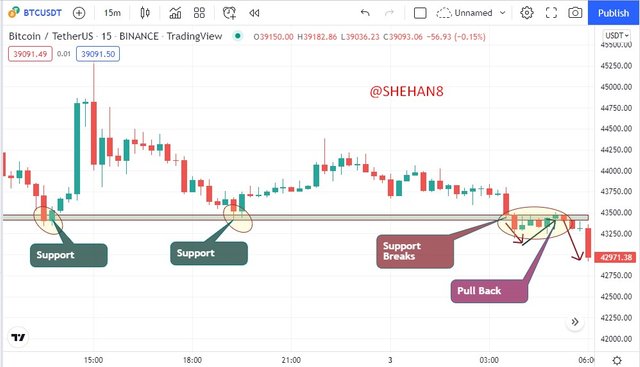
As I explained earlier, support is a very important factor in Crypto Trading. Normally, when support is breaking, a pullback can occur. It means a temporary price reversal can occur towards the broken support line.
Let's see a Support Braking situation in a chart.
Screenshot - https://www.tradingview.com/
In the above screenshot, we can see the price level has broken the support line and a suitable pullback has occurred before continuing the downtrend. We should keep in mind that a pullback will not occur every time especially when a strong trending market. In those situations, the support level can be broken continuously with a big volume, and pull back will not happen.

👉Explanation of Breaking Support
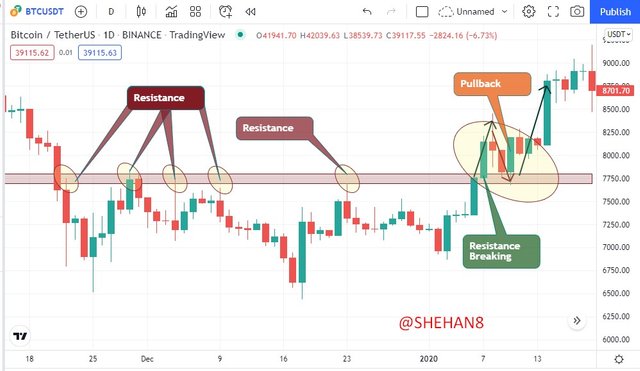
The same is support, when resistance is breaking, a pullback can occur. It means a temporary price reversal can occur towards the broken resistance line.
Let's see a Resistance Braking situation in a chart.
Screenshot - https://www.tradingview.com/
In the above screenshot, we can see the price level has broken the resistance line and a suitable pullback has occurred before continuing the Uptrend. Same as before, we should keep in mind that a pullback will not occur every time especially when a strong trending market. In those situations, the resistance level can be broken continuously with a big volume, and pull back will not happen.

👉Breaking of resistance by using another indicator
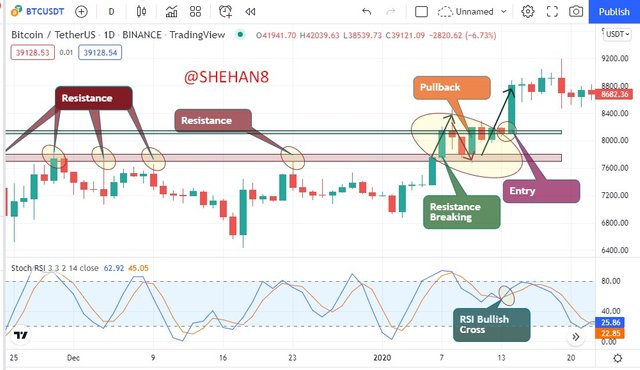
Even if we can use those resistance levels to find our exit or entry points, we can use these resistance levels with another suitable indicator to increase the accuracy of our Trading setup.
So, here I have used a clear Resistance level and Stoch RSI indicator to identify a good entry point using resistance levels. Also, we can see the Stoch RSI has crossed as a bullish cross above the 50 lines. It is also a good sign for a good uptrend. At the same time, we can see the price has broken the resistance and a nice pullback has occured.
Screenshot - https://www.tradingview.com/

Like I described earlier, a support level can become weak when it tests a few times. In those situations, that support level can break towards the downtrend after a suitable pullback. Let's see a support braking situation in a chart and especially I will use another suitable indicator to confirm the price breakage.
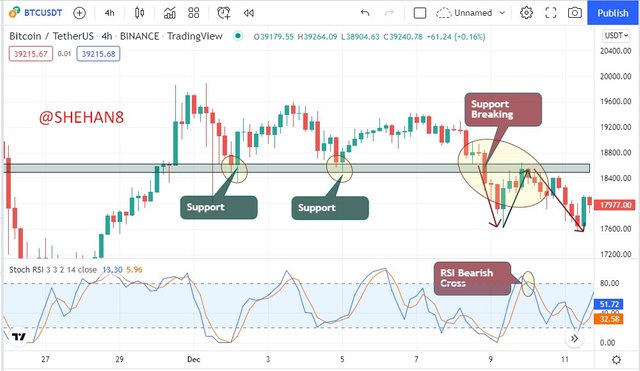
Screenshot - https://www.tradingview.com/
In the above screenshot, we can see the price level has broken the Highlighted support line and a suitable pullback has occurred before continuing the downtrend. At the same time, the Stoch RSI indicator has given a good sell signal when the price level pool occurs a clear pullback and starts to continue the downtrend.
So, if we could take entry when the Stoch RSI shows a bearish cross, we can easily get a good entry for a better sell entry. Specially, we have a higher possibility of winning rate as the price also breaks a good support zone with a clear pullback.

Below I have shown another example for a situation of Break the Support and Continuation. Here the price level has broken the support level directly without a pullback and the price has consolidated in a range below the support. After that, when the RSI crosses as a bearish Cross, the price has started the downtrend again.
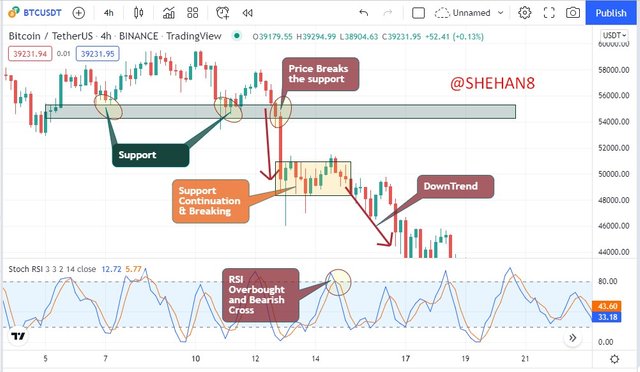
Screenshot - https://www.tradingview.com/

False break is simply an unexpected price movement after breaking a support or resistance level. Here the price level support or resistance level is broken and the price level returns to where it was before. Let's see a false braking situation in a chart.
👉False Break in a Support
Below we can see the price level has broken a good support level and continued towards a temporary downtrend. However, the price level has changed its movement unexpectedly towards the previous support level back proving a false breakout.
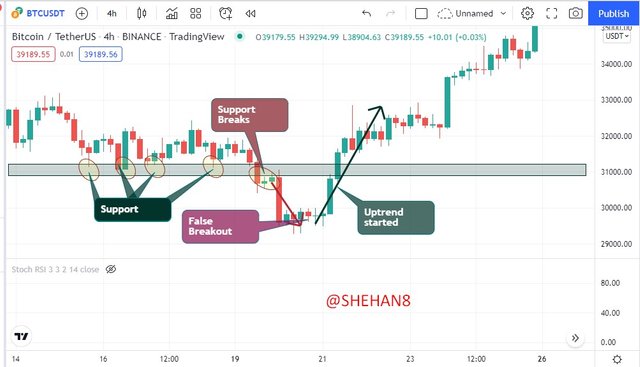
Screenshot - https://www.tradingview.com/
👉How to avoid False Break in a Support
False Breakouts are common in every price chart as the Crypto market is highly volatile. In those situations, we can use another indicator to confirm our entry or exact price movement in the market. Let's do it with an example.
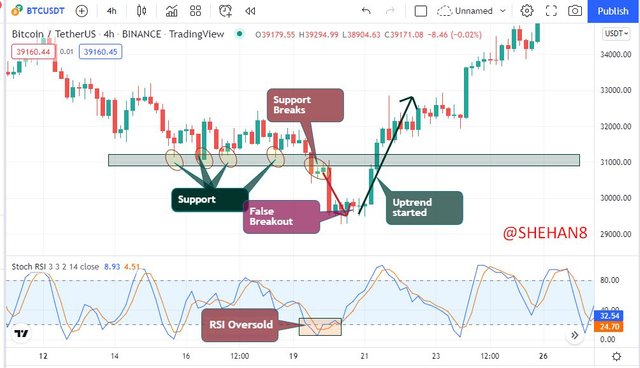
Screenshot - https://www.tradingview.com/
In the above screenshot, we can see the RSI is extremely oversold even if the price level breaks a support level. So, we already know that price rejection can occur in those situations soon. So, we can see the price level has changed its behavior as expected towards an Uptrend.

👉False Break in a Resistance
Below we can see the price level has broken a good resistance level and continued towards a temporary Uptrend. However, the price level has changed its movement unexpectedly towards the previous resistance level back proving a false breakout.
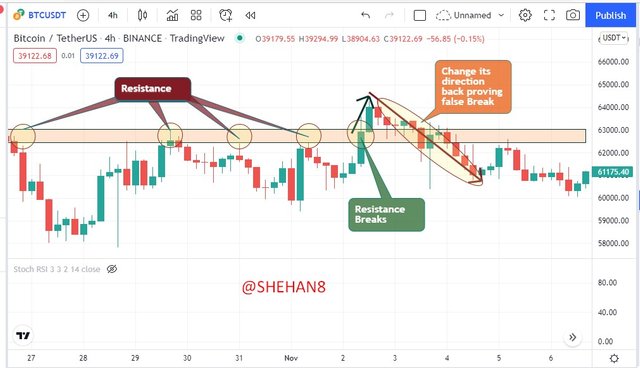
Screenshot - https://www.tradingview.com/
👉How to avoid False Break in a Resistance
Like I said earlier, False Breakouts are common in every price chart as the Crypto market is highly volatile. In those situations, we can use another indicator to confirm our entry or exact price movement in the market. Let's do it again with an example.
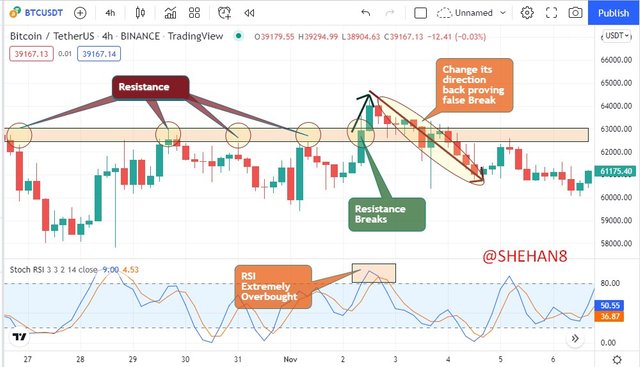
Screenshot - https://www.tradingview.com/
In the above screenshot, we can see the RSI is extremely overbought even if the price level breaks a resistance level. So, we already know that price rejection can occur in those situations soon. So, we can see the price level has changed its behavior as expected towards a Downtrend.

First of all, I can search a good zone where the price level breaks a resistance. At the same time, we can wait for a good retest as the price level can go for a temporary pull back when it breaks a resistance normally. Let's look at my chart analysis.
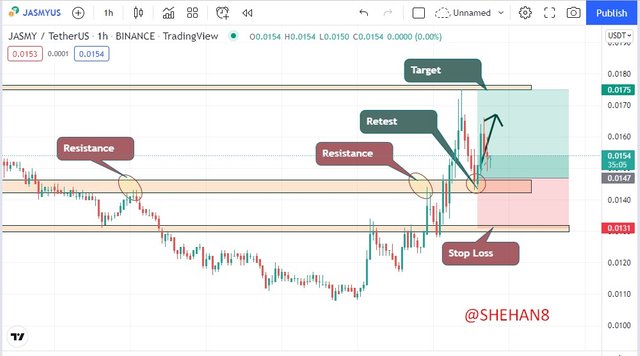
Screenshot - https://www.tradingview.com/
In the above screenshot, I have chosen JASMY/USDT trading pair for demonstrating my demo order. So, here we can see the price level has broken the above resistance level and a good price retest has come. So, I can take my entry when the retest converts to a clear Uptrend. Let's look at my Demo order from the below screenshot.

Screenshot - https://www.tradingview.com/

First of all, I can search a good zone where the price level breaks support. At the same time, we can wait for a good retest as the price level can go for a temporary pull back when it breaks a supports normally. Let's look at my chart analysis.
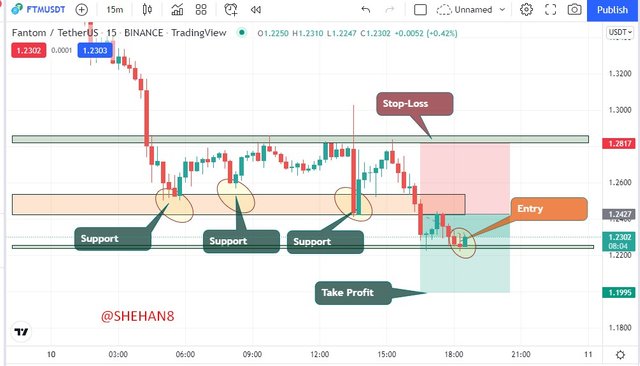
Screenshot - https://www.tradingview.com/
In the above screenshot, I have chosen FTM/USDT trading pair for demonstrating my demo order. So, here we can see the price level has broken below the support level and a good price retest has come. So, here I have taken my entry when the retest converts to a clear downtrend and during the support continuation point. Let's look at my Demo order from the below screenshot.

Screenshot - https://www.tradingview.com/

This is all about my homework post and I thank you to professor @pelon53 for such a valuable topic that was really very educational and helpful for our personal life too.