.png)

Fundamental analysis is the basic way of analyzing something. The cryptocurrency fundamental analysis occurs when traders start finding the real value of assets. The real value is not just the value of the coin it is all about the reality of the coin. Here all the information about the asset is taken from the available public information. Realizing the real value of the coin helps investors to make trading decisions. The fundamental analysis is done in different ways.
First of all, traders have to analyze the company that issues the coin. The traders think about the company revenue as they are going to invest in the asset. Unlike other institutes and organizations, it is difficult to find information about cryptocurrencies to do fundamental analysis.
From the number of users gathered in the coin is a good factor to think about. The things that people gathered in the coin say about the coin is really important for investors. According to the volume of investors in it.
The white paper of a coin gives a lot of details about the coin. The upcoming projects, the team members, and so on. By reading the white paper traders can get an idea of whether this coin is a good investment or not.
Fundamental analysis is important for traders because they can identify the real valuation of the coins they invest in. It gives details about the present condition of cryptocurrencies.
Technical analysis is a computational way of analyzing cryptocurrencies. Here the traders can use their trading platform to technically analyze the cryptocurrency. Traders apply different technical indicators to predict future price changes. There are a number of technical indicators and strategies which traders use in combination to predict the price movement before investing in the coin.
The most common indicators are RSI, MA s. Most indicators have a mathematical calculation which the traders can calculate and get the values. From the answer they get, they decide the type of investment.
Indicators and strategies are used in combination to get a confirmed signal about the trend of the price. Most moving averages are used with indicators like zig-zag, RSI, and oscillator indicators.
There are some key differences between fundamental and technical analysis and I will state the major differences using a table.
| Fundamental Analysis | Technical Analysis |
|---|---|
| It used for analysis for investments | It is used for the purpose of trading |
| Use to identify the real value of the asset | use to identify the entry and exit points of a trade |
| Investors take decisions based on the document information | Traders take decisions on the market trends and price of the asset |
| Base the current data | Base future predictions |
| use present data | use past data |
I have taken the SOL/USDT cryptocurrency pair for this trade. You can see I have marked a clear resistance level. It is clear that the price will move down after touching the resistance line.
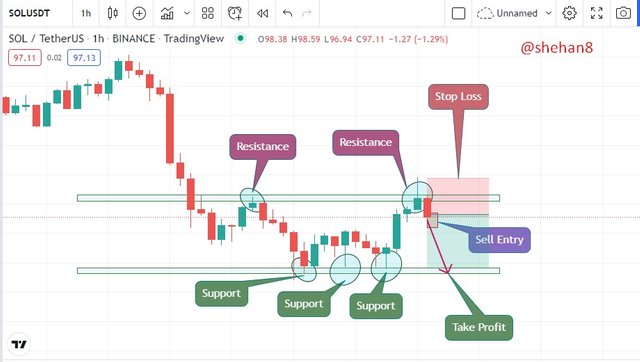
Screenshot - https://www.tradingview.com/
I have used the 30 minutes chart to make a clear price movement. You can see that in the below image. I can take the sell entry from the bearish candlestick that seen is seen. It is clear that the price will change from that position. I have marked the take profit in the recent support level which is below my entry point.
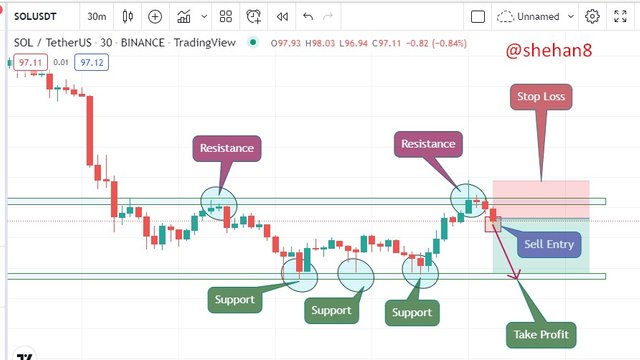
Screenshot - https://www.tradingview.com
I have placed a sell short order according to the above technical analysis setup.
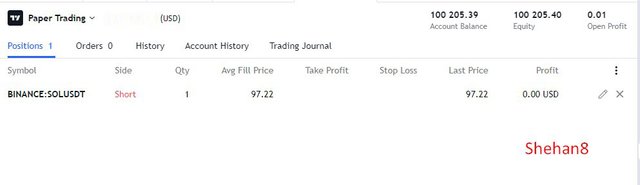
Screenshot - https://www.tradingview.com
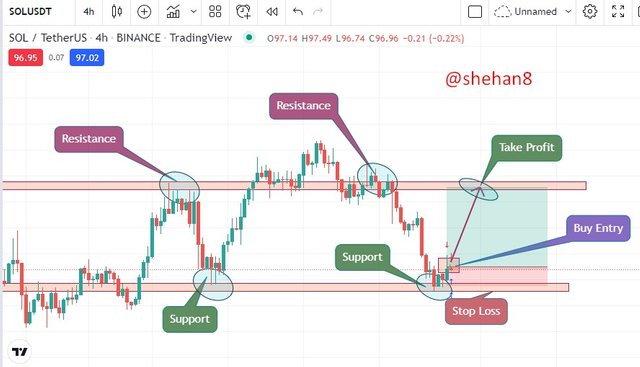
I have taken the SOL/USDT cryptocurrency pair for this trade. You can see I have marked a clear resistance level. It is clear that the price will move up after touching the support line.
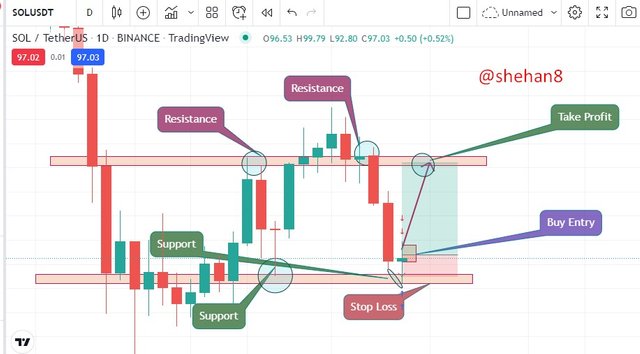
Screenshot - https://www.tradingview.com/
I have used the 4 hours chart to make a clear price movement. You can see that in the below image. I can take the buy entry from the bullish candlestick that seen is seen. It is clear that the price will change from that position. I have marked the take profit in the recent resistance level which is above my entry point.
Screenshot - https://www.tradingview.com/
I have placed a buy order according to the above technical analysis setup.
.jpg)
Screenshot - https://www.tradingview.com
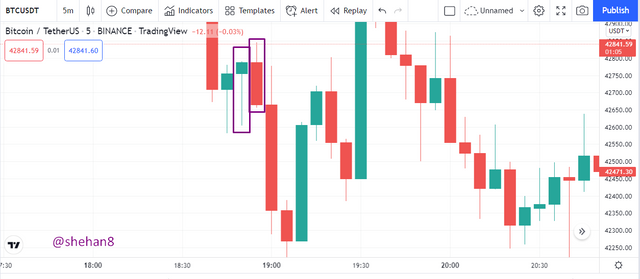
👉 The hanging man
Screenshot - https://www.tradingview.com
The hanging man is a price trend signaling candlestick. This candlestick signals about a price downtrend. The candlestick has a small body with a long lower shadow and a small upper shadow. Sometimes there is no any upper shadow.
This candlestick gives a downward trend signal. We can confirm it by the next candlestick which is located next to the hanging man candlestick. The hanging man candlestick together with the conformation candlestick gives an accurate downtrend in asset price. So this signals the sellers that they can place sell orders.
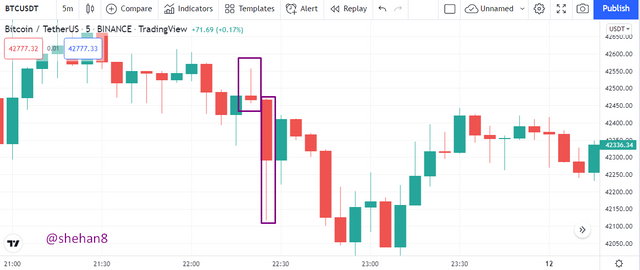
👉 The shooting star
Screenshot - https://www.tradingview.com
The shooting star is also another bearish candlestick that consists of a small body and a high upper shadow with a small lower shadow. The shooting star appears after an uptrend. This also is a candlestick that signals about a price fall after an uptrend.
Here this candlestick also should be confirmed with a confirmation candle which is next to the shooting star candlestick. If the next candlestick is a bearish candle then the sellers can place their orders.
In this lesson, I learned about the main two ways of analysis methods. The fundamental analysis is all about the present data that the investors use for long-term investments and the Technical analysis is used by traders to find entry and exit points in a trade. This is suitable for short-term trades.
Thank you professor @pelon53 for this valuable lesson.