

Usually in the world of cryptocurrency traders on the market are always found utilizing the sentimental or the fundamental analysis for making their chart examine in other to make the best trade entry to take some profit. But today I would like to encourage that utilizing only the sentimental or fundamental is not the best. We all can observe that with the sentimental or fundamental analysis traders always finds it very difficult whenever they want to specify the resistance level and the support level on the chart market. Same as traders find it difficult to specify the danger management on the chart, That is why we always recommend traders who would like to make their analysis before they enter into a trade the technical analysis must always be utilized if only you want a good trade. So here the price action technical analysis is the best for traders to be able to specify their supply and demand, Same as traders can specify the resistance level and support level on the chart to make a good chart examine. Anytime a trader wants to be specifying the best exit level or the entry-level and risk management on the chart, The price action is the best strategy to be used on your chart. As I mentioned earlier the price action strategy is playing a vital role to traders on market for making their analysis, Anytime a trader wants to specify the structure of the market, wants to specify the actual quantity or volume which is going through the market and if they want to specify the stop loss point, Take profit level. This is easy to specify just by studying the action price on your very easy cryptocurrency chart. This should tell us the price action strategy is helping traders in so many ways to make the best trading analysis for themselves.

Below my post I will be listing some outstanding important of the price action to traders on the market.
With the help of the price action traders on the market chart finds it very easy to notice all the negative signal on the chart, The price action also helps to manage all the commotion and the disorder on the market, Due to this, the market is very simple to read to understand to make your analysis.
With the help of the price action traders on the market finds it very simple to specify a good entry-level for their trade, Also with the help of the key chart levels traders can reduce their risk management by recording their stop loss point or taking profit point on the chart, All this can be done by the use of the price action on the chart.
- With the help of the price action traders on the market, Finds it very simple to specify the current market structure, Also with the help, the price action traders can easily specify the resistance level and the support level and also can easily identify the impending trend reversal on the chart, All in the name or help of price action.
Personally I will not be choosing any other technical analysis apart from price action, Because the price action it is playing a great role to traders on market for their analysis. So mainly the price action strategy makes it very easy for traders to be foreseeing the upcoming market movement, Resistance and support levels and the sell or entry level on the market.

Whenever we say Japanese candlestick chart it is an ancient style which was developed by a man called Munehisa Homma, Who was a rice trader, In the year the 1770s. The Japanese candlestick chart was discovered and was impacted by the feeling of all rice traders. As we speak the Japanese candlestick chart is still in use on market for stocks examining, To discover all the price change and the way the market behave to it. Whenever there is an interchange between sellers and buyers on a specific asset a candlestick is been formed.
It is always presented in a graphical form representing all the price movements on the monetary market.The candlestick chart is a very functional indicator that is usually used in the cryptocurrency trading market, Which also displays the notable price changes at every point and also the time to come examine the price change.
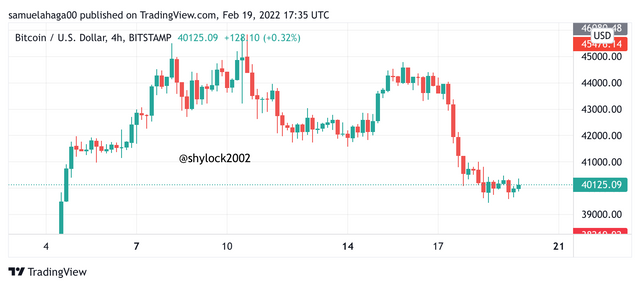
The Japanese candlestick is playing an important role when it comes to the technical analysis of the chart. Which I will be listing some in my next writing.
With the help of the Japanese candlestick traders can simply specify all the bulls and bears on the market, This has been made simply that we can use colors to be checking, So here anytime the bulls manage the market the candlestick turns into green and whenever the bears manage the market the candlestick turns into green.
Some other types of Japanese candlestick include the hammer, Hanging and many can easily be used on your chart to help traders to be foreseeing the impending movement of the market.
With the help of the Japanese candlestick traders can easily be sighting all the reversals of trends on the market. Here all traders must take note that the cryptocurrency asset price is likely to go in an upwards direction anytime the Japanese candlestick try to go closer to the support point, Same as the cryptocurrency asset price is likely to go in a downwards direction anytime the Japanese candlestick try to go closer to the resistance point on the market chart.
For this task, I do not prefer any other chart over the Japanese candlestick. In the crypto market, we have a lot of chart pattern which includes the Heiken Ashi chart, line chart, and many. But with the Japanese candlestick is mostly used and more popular than the other charts we have. Also, the Japanese candlestick prices of the cryptocurrency have been displayed very well on the chart, This also assists all the traders on the market to easily analyze the chart and predict the impending trend movement, The Japanese candlestick helps traders to know if the bulls or bears are in control of the market at that moment and is easy to know with the help of the colors green and red.

Any time we talk about the Multi-timeframe analysis it is simply the utilization of numerous time frames on your cryptocurrency chart, In other to assist you in foreseeing the impending movement of the market and also the best trade entry-level to make some good profit.
So here we always find some traders on market utilizing numerous time frames on their chart just to observe the impending direction of the market. And the time frame can also assist traders in other to observe the correct trade entry levels for themselves.
Usually, the multi time frame is of good use to traders, So here if traders entered the market and would like to observe a correct or accurate stop-loss, Take profit and energy level on the chart they must always go for a short time frame which is very useful, Whiles anytime traders entered the market I would like to observe a correct direction of the trendlines on the chart they must always go a long time frame which is also very useful to traders.
Here traders who would like to enter a long-term trade are always recommended to be utilizing the monthly or the weekly timeframes to help them observe the trendline of the market. Anytime they want to observe their stop loss or entry, They can make use of a short time frame on their chart.

- With the help of the multi time frame traders are simply to observe a correct stop loss or entry-level by utilizing a short time frame on the chart, Whiles with the help of the multi time frame traders are simply to observe the impending trendline path by utilizing a long time frame on the chart, This will help traders to know the best time to enter a trade to take some good profit and minimize loss.
- Also with the help of the multi time frame it assists traders to market to escape vast risk management of their assets, That is when traders utilize the multi time frame we can observe the correct stop loss to be used on our trade this is going to reduce the risk management for their trading.
- Also the multi time frame helps traders to be sure of their trading chart signals, That is traders are always recommended to be making use go numerous time frames like 1 DAY, 1 HOUR, 4 HOURS and a WEEK, To assist them in verifying their chart signals before the begins the trade.

For this task as the teacher stated you can use any time frame, So I will be using a 1 DAY time frame for my chart analysis and will also be trading with a 2 HOURS time frame on my chart, This way of trading is normally classified as a long term trader. I will be presenting a 1 DAY chart below.
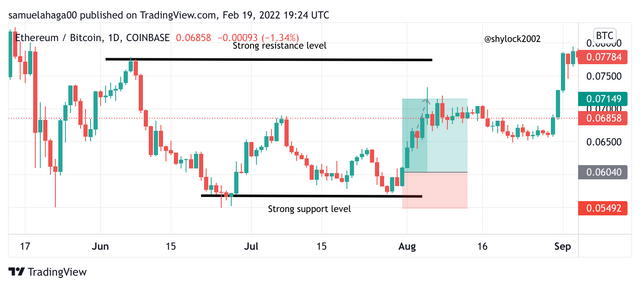
When you take a look at my 1 DAY observation the resistance level and the support level are very obvious. So when you again look at my chart it clearly shows the support level and resistance level when observed it happens to very strong. Anytime we see a candlestick is moving downward we take the chance to put an entry trade on the chart. Whenever the support level is very powerful you are good to put your tight stop loss on your chart. In my next writing, as I stated earlier, I will be trading with the 2 HOURS timeframe on my chart.
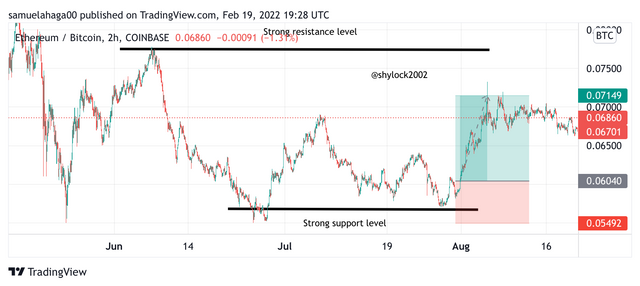
When you check my 2 HOUR timeframe chart when we perform our trading, We can see that our action price on the 1 DAY is quite alike to our 2 HOUR time frame.

I will be presenting a chart below my next writing.
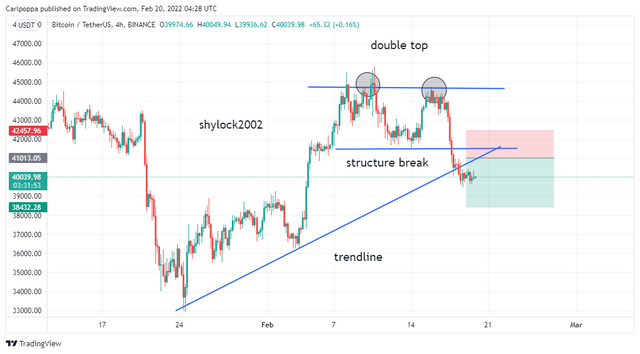
When you look at my screenshot I uploaded above you can see my 4 HOURS chart was having a strong double top, There was also a structure break.
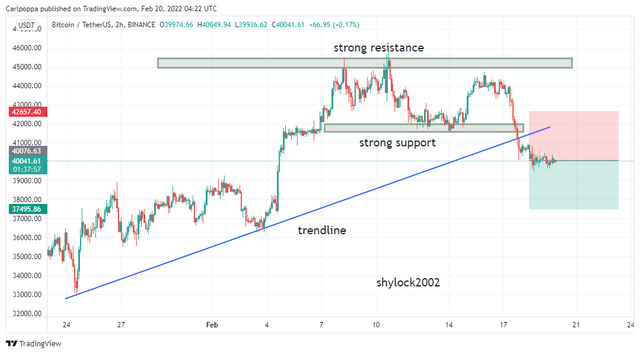
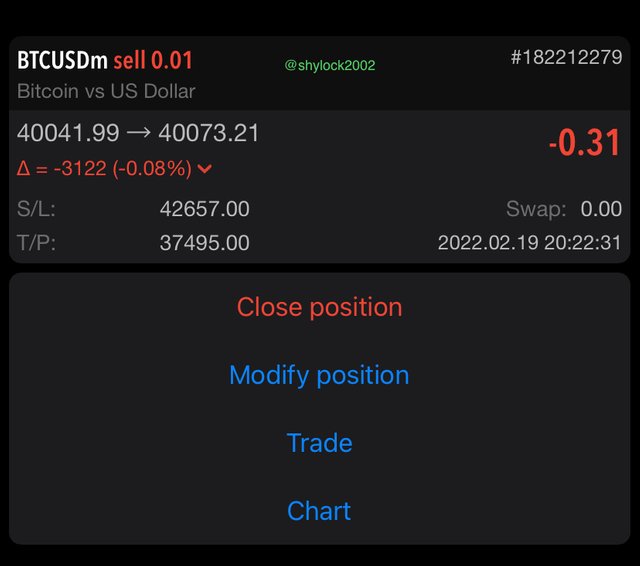
From my 2 HOURS BTCUSDT chart it was having a strong support level and a strong resistance level.I them placed my order.

I would again like to thank prof @reminiscene01 coming out with such a great lesson, Indeed I have learned a lot from this lesson. And with the price action strategy , I would like to encourage everyone to use together with other indicators for making their analysis this will make your analysis very accurate.