Welcome to another season of the crypto academy, And this happens to be the first week of season 6. The lesson given is about Effective trading strategy using line charts which was assigned by prof @dilchamo, So without wasting much time I will begin my task immediately.
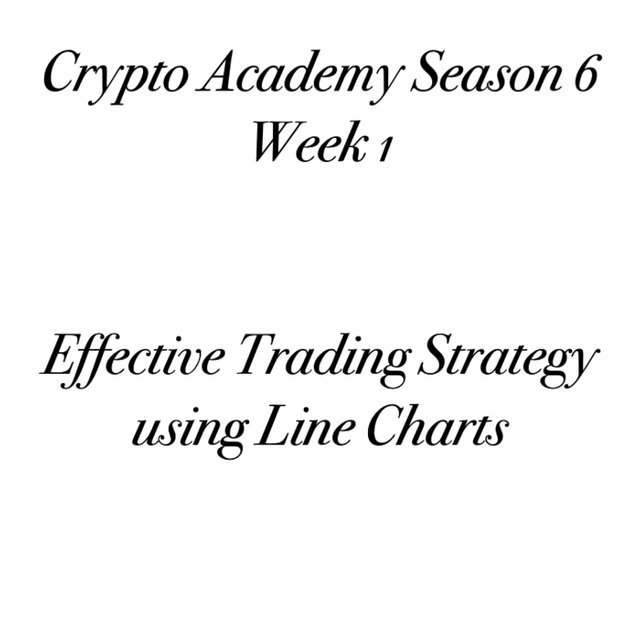

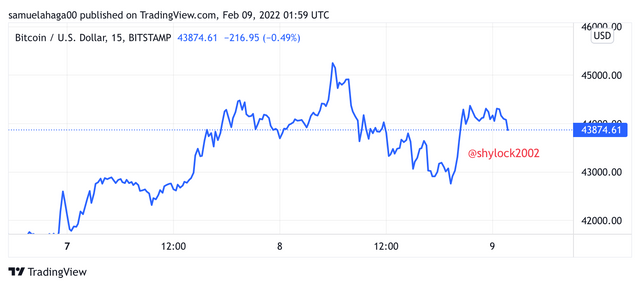
I believe we all might have heard of a line chart or have little knowledge about line charts since is familiar to most of us. So in my own words or opinion, I define a line chart as one of the easiest or fastest means for any individual to predict or imply the price development of any cryptocurrency on market in a specific time. Besides almost every individual in the trading market would go for the line chart due to its clarity to study and also ease of comprehension. The line chart happens to be built in a way that it always links and also constitute the price data on a market chart, This is always done by utilizing just one line, This one line must be able to begin again in the time ahead on the chart just as linking the close price of the cryptocurrency on the market. From my research, I was able to find out the line chart differs from all the different complex chart individual always utilize in the market for their analysis. The open, High, Close, and low, Happens to be other charts that constitute all of these price data, Because these charts constitute different price data it makes individuals in the trading struggle enough to foresee the price be in the in time to come. The line chart is playing an important role to traders in the market, As I stated earlier the line chart happens to be a chart that is only acceptable by linking just the close price of a cryptocurrency on the market and this can be done by utilizing just a single line on the market. With this it gives all the individuals in the trading market a clear understanding of the chart anytime they make their analysis, Also this will help them know the proper method to utilize their price data in other to make the best analysis for themselves on the market chart.
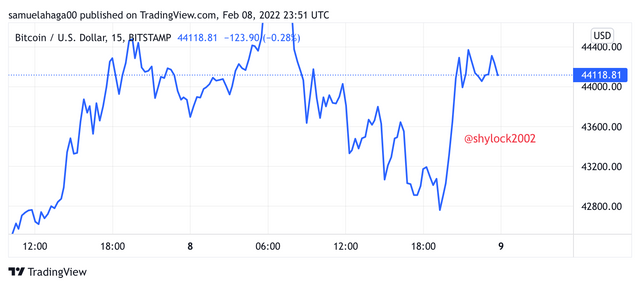
Also the line chart, can easily be used by traders in other to be foreseeing trends on the market chart.
Each time there would be any reversals in the market chart the line chart can be utilized, In other to notice all the reversals on the chart at a later time.
With the line chart can be used by individuals in the trading market just to go after all the advancements in the market, This can either be long or short intervals on the market.
With the line chart, helps individuals in the trading market to study and have a clear understanding to make the best analysis for themselves.

We have two levels that are helping all individuals in the trading market that is the support levels and resistance levels, To get adequate knowledge about the worth of any cryptocurrency asset in the market. This type of line is always portraying all the biggest intersections between sellers and buyers on the market. This is also where the demand and supply are very effective which sometimes affects the prices of the asset on the market.
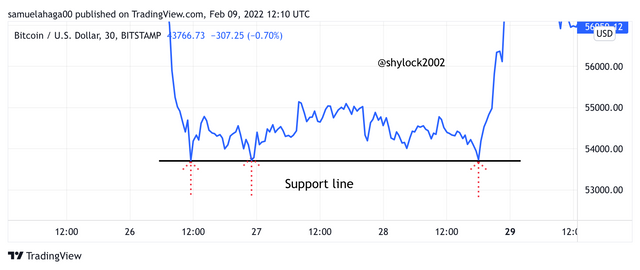
Now let's talk about the support line on the chart, It is playing a major role to traders, That is the support line act as the ground and it always happens to be found down the new price on the market chart. In the purchasing aspect that is where the support line is been powerful, Due to this, it serves a major purpose and also s the price on the market, Which is beginning again just to drop down such level.
Let's get to see how we can identify each level using a line chart.
SUPPORT LEVEL:
Anytime we say support level, This simply tells us that we are in a point or situation whereby the price of cryptocurrency assets quits in dropping market, In this situation, we encounter the presence of buyers more than sellers on the market, Also there is also a situation which all buyers on the market begin to show much attention in a specific cryptocurrency asset just to help maintain the price of cryptocurrency assets to be able to quickly returns to it regular position on the market and we will have our line been illustrated similarly on the market chart.
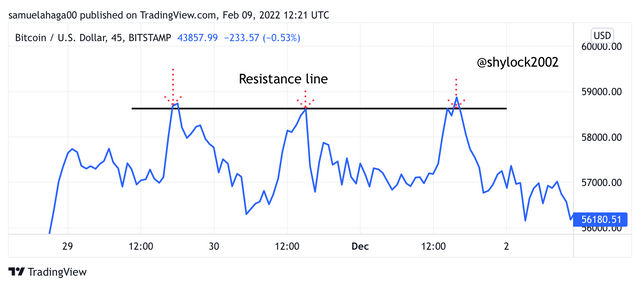
Now let's talk about the resistance line It is playing a major role to traders, That is the resistance line act as the roof to traders and it always happens to be found at the top of the new price on the market chart, In the selling aspect that is where the resistance line is been powerful, Due to this, it serves a major purpose and also the price on the market, Which is beginning again just to increase up such level.
Let's get to see how we can identify each level using a line chart.
RESISTANCE LEVEL:
Anytime we say resistance level, This simply tells us that we are in a point or situation whereby the price of cryptocurrency assets quits in increasing on market, In this situation, we encounter the presence of sellers more than buyers on the market, Also there is also a situation which all sellers on the market begin to show much attention in a specific cryptocurrency asset just to help drop the price of cryptocurrency assets on the market and we will have our line been illustrated similarly on the market chart.

The line chart and the candlestick is never the same and I believe everyone is aware, Each chart has their uses for traders.
LINE CHART.
So with the line chart, I earlier mentioned that it is always illustrated on the chart by a line. Due to this, It helps traders though but traders also lack more details about price data on the market chart which could help them make their analysis. It is very easy to study and understand so a lot of traders utilize the line chart for their trading analysis. I also stated earlier the line chart is only capable of just linking a cryptocurrency asset's close price, Which is utilizing the lines.
CANDLESTICK CHART.
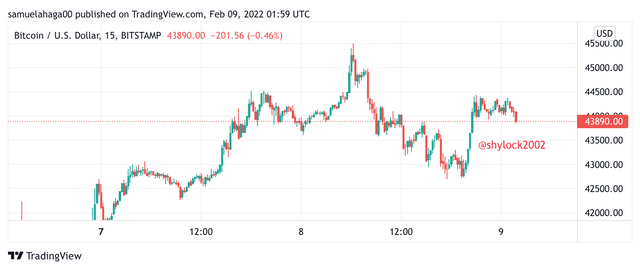
When we consider the candlestick is well known to be portraying price data, That is it helps to show the open, close, high, and low price of cryptocurrency assets in a particular time on the market chart. The candlestick is also helping traders a lot on the market as it can be used by traders just to find out the dealing in the middle of the buyers and sellers on the market chart.
When you take a good look at the candlestick chart I have uploaded below it looks different from the line chart. The candlestick newbies or traders with less knowledge find it very difficult to comprehend due to how it is been illustrated on the chart. With the candlestick the sellers and buyers play different roles on the market when it comes to colors of the candlestick this is to tell is whether the sellers are in control of the market or the buyers are in control of the market. Because of these that is why most traders on the market prefer the line chart over the candlestick, With a reason that the line chart is very easy to study and comprehend chart even for newbies or traders with less knowledge and can also help predict the later price on the market.

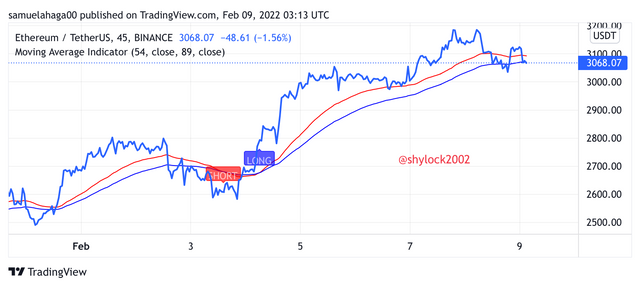
For this task I will be utilizing two different types of indicators with the line chart, The indicators I will be using are the Moving Average Indicator and the Bollinger band indicator.
Moving Average Indicator
The Moving Average Indicator happens to be one of the popular indicators a lot of traders often used in the market chart. So for this, I am joining the Moving Average Indicator with the line chart, The Moving Average Indicator serves mainly on the market chart as an illustrative of the moving average of cryptocurrency assets at a specific period, and also the Moving Average Indicator always utilizes just one line when it comes to the illustrations of price indication on the market chart. We all can testify that whenever a good or professional trader wants to make an analysis they always or recommend adding two or more good enough indicators, So traders can add the Moving Average Indicator and the line chart just to have an understanding of their chart, So this will help them to know the rightist time to begin their trades to prevent lost.
Fibonacci Bollinger band
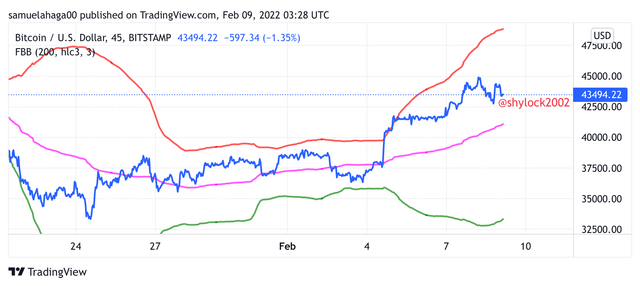
The Fibonacci Bollinger band happens to be one of the popular indicators a lot of traders often used in the market chart, So for this, I am joining the Fibonacci Bollinger band with the line chart. Most traders make use of the Bollinger band by joining with the line chart, This is going to provide traders on the market a lot of accurate details on how the market doing. The Bollinger band always leads traders to make an accurate analysis, Because it fulfills the resistance and support level on the market chart.

We all can bear to it that anytime an individual enters into trading, They only think about one thing that is making enough profits than losing. So traders must be able to observe the bullish and bearish movement of trend, This is going to give a guide to the individual entering into the trade, That is either enter a buy or sell trade per your analysis so traders must get a good understanding when observing the bullish and bearish trend movement.
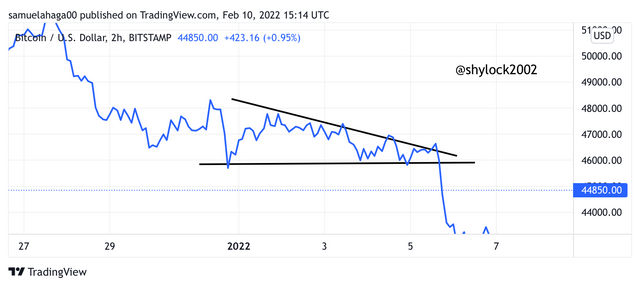
From my research and my understanding of prof @dilchamo lectures, it was clearly stated that the descending triangle together with the line chart, Could be the best way traders can utilize when observing a bearish trading opportunity. So when traders try to use the descending triangle they must be able to notice a lower high which is endless and must be able to turn down from the market chart deliberately. So from this, we can be able to see that the signal that will be following is going to be powerful (bearish), This is going to cause the actual price on the market to be in a vast lower trend on the market, This is going to affect some traders that enter in a sell trade.
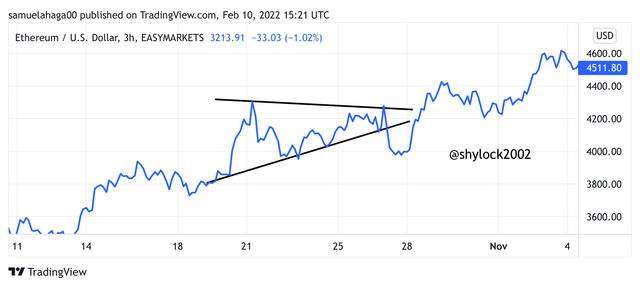
From my research and my understanding of prof @dilchamo lectures, it was clearly stated that the ascending triangle together with the line chart, Could be the best way traders can utilize when observing a bullish trading opportunity. So when traders try to use the ascending triangle they must be able to notice a higher high which is endless and must be able to move up from the market chart deliberately. So from this, we can be able to see that the signal that will be following is going to be powerful (bullish), This is going to cause the actual price on the market to be in a vast upper trend on the market, This is going to affect some traders that enter in a buy trade.

- With the line chart, newbies or traders with less knowledge can study the chart and understands it very fast and easily.
- With the line chart, I have been specially created in a way that, always utilizes just one line in illustrating any price of cryptocurrency on the chart and it does not come with many details.
- With the line chart it has been specially created in a way that it always makes it possible for traders on the market to be recognizing the resistance and support level, With the line chart is going to help eliminate all the commotion on the chart market, This is purposely to help traders on the market to know that righteous time to either purchase or sell their cryptocurrency assets in other to make enough profit.
- So with the line chart since it is always illustrated in lines on the chart, Not every time the line chart is obvious at times the line chart can be confused which can hinder traders from making a rightful judgment if care is not taken.
So with the line chart it is always wanting other essential facts such as gapping which could help traders in making good analysis, But unfortunately the gapping is not usable on the line chart.
So with the line chart it is always known to be inadequate when it comes to the short timeframe on the market chart.

Before I conclude my whole task, I would like to make some recommendations here, The line chart is one of the good charts which newbies or traders with less knowledge could study and understand clear unlike the other chart such as candlestick, Because it is made up of different lines joined together traders with less knowledge finds it difficult is understanding and if care is not taken traders might end up making the wrong decisions for themselves. Normally I always prefer adding the Bollinger band and moving average indicators along with the line chart to get an accurate analysis before they enter the trading.