

1a) In your own words, explain Technical indicators and why it is a good technical analysis tool.
Whenever a trader wants to prosper in his or her trading,There is a need to have an idea or good understanding of what we call the technical indicators. As we all know the list of old market price movements can be used in order to determine the future of the price movement.Whenever we take the old market movements price into thought and next constitute in a graphical presentation,This will help give an extra understanding to the traders,With this a technical indicator will be in order.The technical indicator is the outcome of group of separate price facts.When we take this price facts into thoughts we then use a mathematical formulae in order to find out the price,This will also help us to be able to know our future price movement of your assets.
TECHNICAL INDICATOR: When we say technical indicator it is a fine technical instrument,With a reason that it is very adaptable to it uses.The fundamental objectives of this technical indicator help examine crypto assests,Which is really helping investors and traders to construct the greatest decision on market in time of trading.It is also best used in predicting on the market trend ( bullish or bearish),Also the technical indicators help to give rise to buy and sell signal when we utilize the buy and sell requests on the trading market.We usually join two or more indicators which really help traders or investors to get an accurate outcome.

1.b)Are technical indicators good for cryptocurrency analysis? Explain your answer.
From my research and understanding,I can boldly say the technical indicator is the best for cryptocurrency trading examine,This is because it is very adaptable and it also goes with a reason that you can obtain or loss on the market in the shortest time,For a trader or investor to escape from loosing the indicator must be used properly on their assests,The technical indicator is not 100% accurate for analysis,Therefore you must join two or more indicators for analysis on an assest.Also the technical indicator has the power to notice all the reversal market possibilities and progression of the new price on the market trend(bullish or bearish).

1.c)Illustrate how to add indicators on the chart and also how to configure them. (Screenshot needed).
To perform this task follow the steps below.
You first need to tap the link to launch your TradingView.
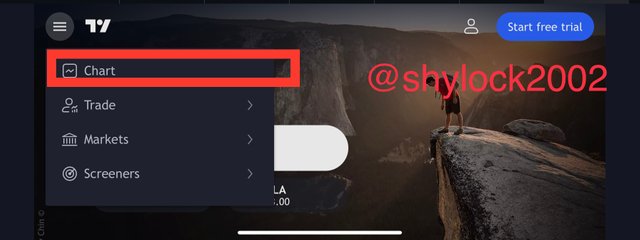
After you launch your TradingView you then click on chart.
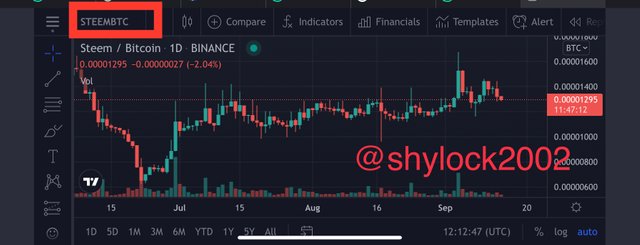
- You then select any pair of assest of your choice,In my case I chose STEEM/BTC.
- You then look at the top of your chart and locate fx,And search any indicator of your choose.In my case I decided to search vortex indicator.
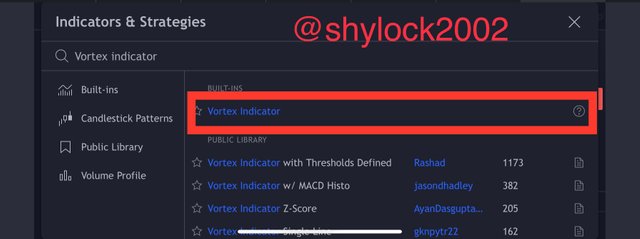
- After you search your vortex indicator you then click on it to be added to your chart.

- The indicator has been successfully added to our chart.
STEPS FOR HOW TO CONFIGURE A TECHNICAL INDICATOR.
- First,You need to tap on your indicator a pop up menu will appear,Click on the setting icon.

- After you tap the setting icon,A menu will appear that is where you can find your length,You then change length to your choice.
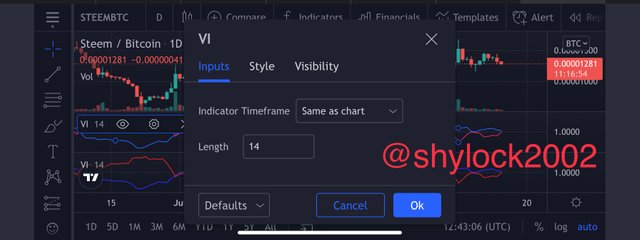
- I moved to my style to edit,I decided to change v- to color white and v+ to color red.
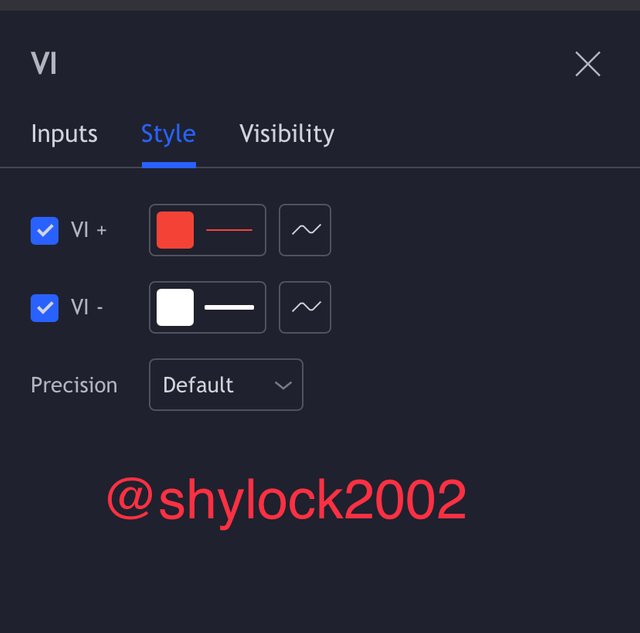
- You can use same procedure to edit your visibility.


2.a) Explain the different categories of Technical indicators and give an example of each category. Also, show the indicators used as an example on your chart. (Screenshot needed).
TREND BASED INDICATOR
This indicator is specifically made usually to help display the market trend(bullish or bearish).It is also the most easy indicator to be used by both beginners and professionals to forecast the market trend just by taking a look at the trading chart.The trend indicator is also helping investor and traders to have a good understanding of the trend direction.With the trend based indicator it make it possible for all users to still understand it there is a strong trend or weak trend.
Examples include Ichimoku Kinko Hyo, Average Directional Index (ADX)
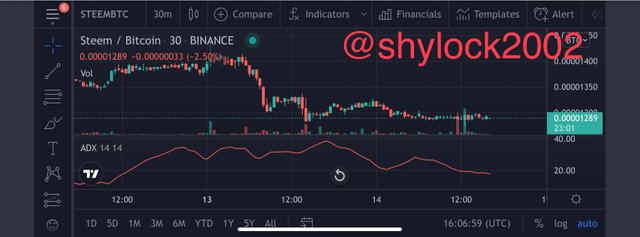
VOLATILITY INDICATOR.
With this type of indicator it is usually a place we can find all the prices of the assest to be adaptable,Therefore a continual volatility in all the assest of the prices.With this type of indicator you are always alert on the continual downward and uptrend movement trend and also show some day of the price movement is push.
Examples include bollinger bands, Average True Range.
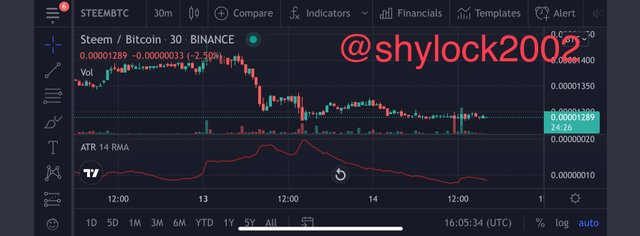
MOMENTUM INDICATOR
With this type of indicator it is usually used to show how powerful of existence of an assest and it also help to notice a market trend reversal which will be happening soon,This help traders to know when to buy assest and when you make profit.
Examples include Stochastic, Relative Strength Index.
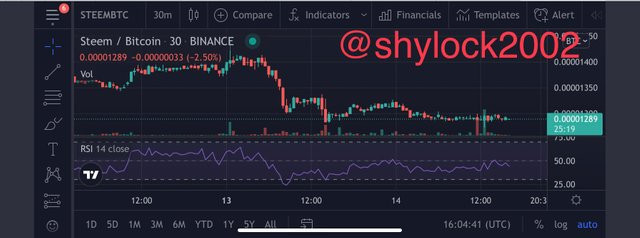

2.b) Briefly explain the reason why indicators are not advisable to be used as a standalone tool for technical analysis.
To my understanding,I have been able to found out that not every time an indicator will give out accurate outcome,Occasionally it can also give out incorrect signal.Due to this it is not a good advice for an investor to trade by considering only one indicator,But rather the inventor should also examine other indicators before he or she take decision to get an accurate results.

2.c) Explain how an investor can increase the success rate of a technical indicator signal.
For an investor to increase the success rate of a technical indicator signal,It is always advisable for the investor to know precisely how the indicator operates and also the best parameters to be used in trading market.Investor must not use single indicator in their technical examine but rather Investors must take the chance to examine two or more indicators to help get a correct signal.

CONCLUSION
I would like to thank prof @reminiscence01 ,For such a great lesson,I have been able to learn a lot on this beautiful lesson.I would like to end by repeating this,All investors should use two or more indicators to help them get an accurate outcome.