
link to my previous work
Today I will be presenting my homework task for prof @sachin08, Which he lectured about Trading using wedges. The lesson was filled up with a lot of knowledge and understanding, Without wasting much time I will begin my work immediately.


Whenever we say the wedge pattern it is defined to be the price structure that is always noticeable, Which is connecting at least two trend lines on the market chart. Normally the two trendlines are always attracted to joining the highs and the lows of the recent trend on the market and the trendline is also the coming together of lines which shows that highs and lows in the recent trend are likewise to be growing or sliding. And the wedge pattern is always a pointer of a trend reversal on the market And is likewise to be in a bullish or bearish trend reversal on the market chart and this always relies on a path of the expected trendlines on the market. Usually, they are two types of wedge patterns and it includes rising wedge and this is always relating to what we call the bearish reversal and the falling wedge pattern and this is always relating to what we call the bullish reversal.
ATTRIBUTES OF THE WEDGE PATTERN.
Wedge pattern must always be ready for merging trendlines.
Wedge pattern must always be ready to give a structure of reducing figures in trends on the chart market.
There must always be a getaway in at least one of the trendlines on the chart market.
Usually, the rising wedge pattern is always related to what we call the bearish reversal on the chart market. Normally we have the wedge pattern to be defined as an upwards bend of a trendline on the chart market, And also the coming together and the escaping of a lower trendline. In the rising wedge traders always detects all the cost on the chart market in a higher trend although for degenerating figure whenever the cost develops in the pattern and also when the trendline is coming together normally communicating the existence of the upward trend and also the beginning of the downward trend once the price splits the lower trendline on the market. So in this case, The rising wedge is usually created subsequently for an upwards trend or still in the period of downward trend on a chart market. Normally when the trendline happens to be subsequently in an upwards trend, This is going to give traders a trend reversal on the market and this may occur as a bullish to the bearish trend. So this means the trendline is moving from downwards to an upward trend. When the trendline is created in the periods of the downward trend, This is going to give the duration of a recent trend on the chart market.

All traders or investors must be able to abide by all these to prevent them from falling as a victim of losing their profit when they intend to start trade. As the name signifies a rising wedge, Here most traders on the market always take the advantage to sell their assets in the account to make much profit.
Normally traders must always take notice whenever the trend progresses, The figure is also going to drop.
Also in the market chart traders must always be sure that there is a split of the lower trendline on the market chart and this is always provided as uphold.
In most cases we have two trendlines on the chart market and we have one trendline linking almost three to five high marks on the market and we have the next trendline to be linking all the low marks in the trend on the chart market, And also the two trendlines must be willing to hold an upward bend and must be willing to come together and must have the capabilities to be encountered to points on the market.
Usually, the falling wedge pattern is always related to what we call the bullish reversal on the chart market. Normally we have the falling pattern to be defined as a downwards bend of a trendline on the chart market, And also the coming together and the escaping of an upper trendline. In the falling wedge traders always detects all the cost on the chart market in a lower trend although for degenerating figure whenever the cost develops in the pattern and also when the trendline is coming together normally communicating the existence of the downwards trend and beginning of the downward trend once the price splits the upper trendline on the market
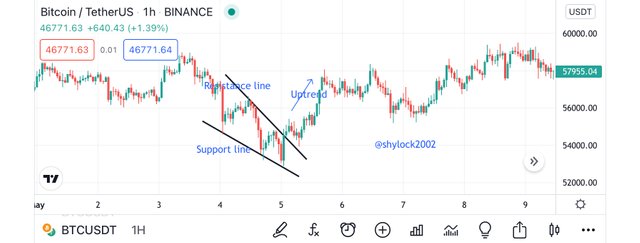
Here most traders on the market always take the advantage to buy more assets into account since the price has dropped and sell it when the price goes up to make a profit.
- Whenever traders come in the market they must always see to it that whenever the trade figure happens to be compressing this makes the trend keep ongoing.
- In most cases we have two trendlines on the chart market and we have one trendline linking almost three to five high marks on the market and we have the next trendline to be linking all the top marks in the trend on the chart market, And also the two trendlines must be willing to hold a downwards bend and must also be willing to come together and must have the capabilities to be encountered to points on the market.
- Also in the chart market traders must always be sure that there is a split of the upper trendline on the chart market and this always provide protection.

It is always not recommended for traders to be using only one indicator for making their technical analysis on market this may not help them get an accurate result For all traders to escape false signals they must add two or more indicators to get an accurate outcome. So the wedge pattern is unusual, So it can also give out fake signals to traders on the market at times. Now let see something here, Each time there is a falling wedge pattern on the market, What always comes to mind of all traders is that they expect the price to be going in a rising wedge pattern, But at times the cost of the asset will again in a falling wedge pattern in sometimes After it will go to it usual falling wedge. This is also going to call the attention of some traders to trade per their examining and this is going to cause them negative signals to the traders on the market at that moment.
So for traders to prevent themself from a negative signal on From the wedge Pattern this is concluding with this indicator called RSI, This indicator is going to give extra support to traders, To find an asset to likewise in overbought or oversold zone on the chart market. From this examine l, Whenever a wedge pattern is created on the market, So with this, we will be having a rising wedge pattern which will be showing a stronger downtrend that will be beginning, So with this, we can use our RSI to detect if truly the assets have been able to go in an overbought as it is indicated on the chart market. When you are done checking everything traders are free to start their trading.
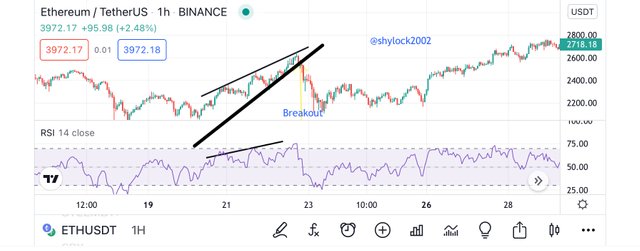

Trade Setup for a Rising Wedge
In my previous writing I made mention of a rising wedge to be relating to a bearish reversal on the chart market due to this we always assume the existence of the uptrend on the chart and also the beginning of the downtrend, This makes traders make only one decision on the market, That is to sell their assets since all traders on the market predict the cost of the asset to be rising, Also when traders on market sketch their subsequent trendline on the chart, There must always be a split of candlestick dropping under our lower trendline on the chart market which is also acting to be the backing. Here when traders make a sell order when they are in the market, They usually place their take profit and loss level could be in a whole of three, That is a side will aid one and the other side will aid two, Normally traders always place their stop loss level to be part up the maximum mark to be on the above trendline on the market and traders may also dual their take profit level and this is also a danger to traders.
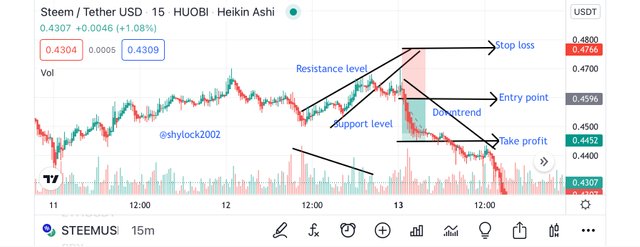
Trade setup for a Falling wedge.
In my previous writing I made mention of a rising wedge to be relating to a bullish reversal on the chart market due to this we always assume the existence of the downward trend on the chart and also the beginning of the upward trend, This makes traders make only one decision on the market, That is to buy more assets since all traders on the market predict the cost of the asset to be dropping. Also when traders on market sketch their subsequent trendline on the chart, There must always be a split of candlestick increasing under our lower trendline on the chart market which is also acting to be the protection. Here when traders make a buy order when they are in the market, They usually place their take profit and loss level could be in a whole of three, That is a side will aid one and the other side will aid two, Normally traders always place their stop loss level to be part down the minimum mark to be on the below trendline on the market and traders may also dual their take profit level and this is also a danger to traders.
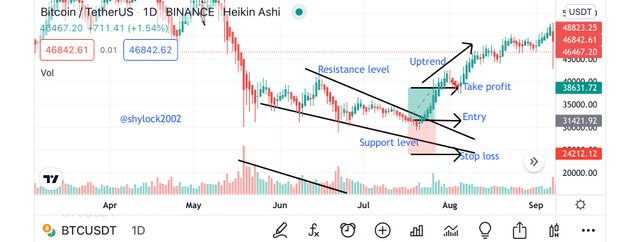

CONCLUSION.
Once again I would like to thank prof @sachin08 for such as incredible lesson. I have been able to learn a lot from this task and I will also like to edge all traders to be always using two or more indicators on their chart in other to prevent false signals.