
QUESTIONS
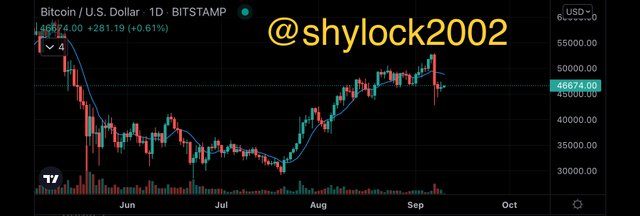
1a) Explain the Japanese candlestick chart? (Original screenshot required).
b) In your own words, explain why the Japanese Candlestick chart is the most used in the financial market.
c) Describe a bullish and a bearish candle. Also, explain its anatomy. (Original screenshot required)

1a) Explain the Japanese candlestick chart? (Original screenshot required).
Whenever we say Japanese candlestick chart it is an ancient style which was developed by a man called Munehisa Homma,Who was a rice trader,In the year 1770s.The Japanese candlestick chart was discovered and was impacted by the feeling of all rice traders.As we speak the Japanese candlestick chart is still in use on market for stocks examining,To discover all the price change and the way the market behave to it.Whenever there is an interchange between sellers and buyer on a specificic assest a candlestick is been formed.
It is always presented on a graphical form representing all the price movements on monetary market.The candlestick chart is a very functional indicator which is usually use in cryptocurrency trading market,Which also displays the notable price changes at every point and also the time to come examine of the price change.


1b)Why Japanese Candlestick Is The Most Used In The Financial Market
The Japanese candlestick chart is mostly used in market because it usually gives correct and a comprehensive of a graphical representation of all price change at every period of time.It also help to display all the numerous price tip throughout the interchange between all the sellers and buyers.
Usually they are been showed graphically,The give and request which is the factor in all the time of price movements.

"1c. Describe a bullish and a bearish candle. Also, explain its anatomy. (Original screenshot required)"
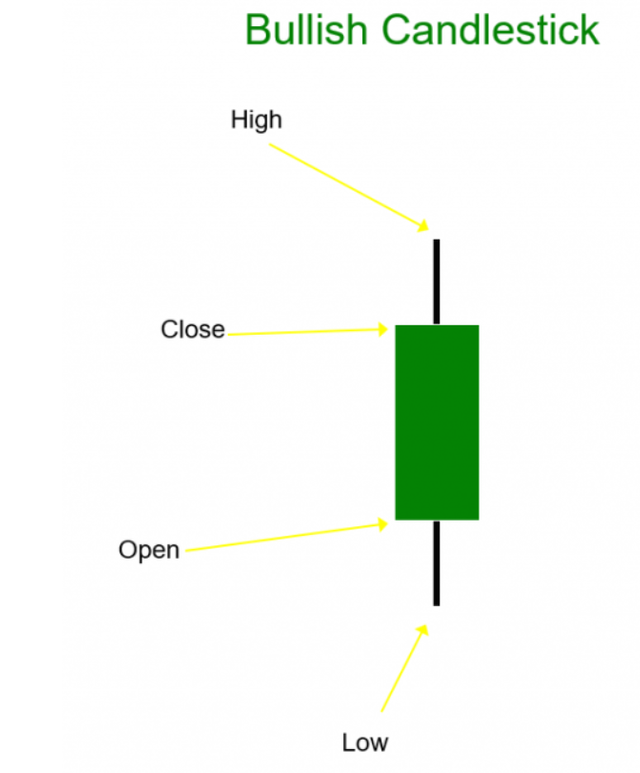
BULLISH CANDLESTICK
The bullish candlestick always has it price opening level under the price closing level,Which is a very fast gesture of perhaps of the carrying on an uptrend movement.Colors such as green and white are some bight colors of bullish candlestick,That is depending on type of trading configuration.

Anatomy Of A Bullish Candle.
The bullish is having a four main parts.Which we have high,Low,Open and close.
OPEN
When it comes to the open it the part which directly specify the starting of all the price movements.
CLOSE
When it comes to the close it the part that spot the finish of the candle in a particular period of time,That specify your last price listed.
HIGH
When it comes to the high it is also a part of candlestick that specify a highest price listed in every particular time.
LOW
When it comes to the low it is a part that displays the lowest price listed in every particular time.
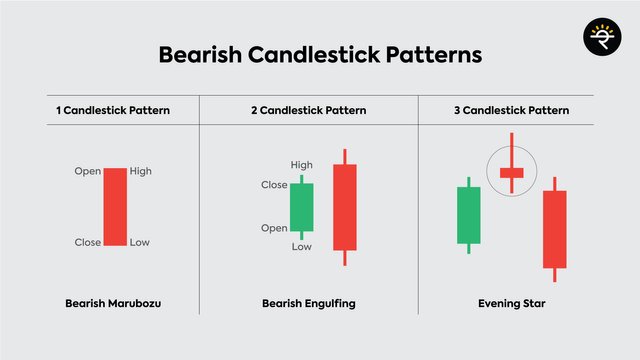
BEARISH CANDLE.
This is a type of candlestick pattern that makes in an uptrend showing a reversal in facing direction.With this it actually means that the seller has been able to take power of all the price the buyer is unable to find.

Anatomy Of A Bearish Candle.
The bearish is having a four main parts.Which we have high,Low,Open and close.
OPEN
When it comes to the open it where the place was then,Throughout the begin of time interlude.This makes the bearish candle open price to be higher than its close price.
CLOSE
When it comes to the close it is where the price was placed at the close of time interlude.This makes the bearish candle close price to be lower than the open price.
HIGH
When it comes to the high it is usually the highest tip the price has been able to reached throughout the time interlude.With the high price it informs us how bearish has impelled throughout the time interlude.
LOW
When it comes to the low it is usually the highest tip the price has been able to reached throughout the time interlude.With the low price it informs us how bearish has impelled throughout the time interlude.
@steemcurator02
Downvoting a post can decrease pending rewards and make it less visible. Common reasons:
Submit
@reminiscence01 @steemcurator02 @sapwood
Please my work has not been curated and is already up to 7 days what should I do next please
Downvoting a post can decrease pending rewards and make it less visible. Common reasons:
Submit