Greetings everyone, I am delighted to once again take part in this week's lesson of our noble professor in the person of @kouba for this wonderful lesson.
This week, we have been taken through yet another great indicator which is used to help add meaning to various crypto assets charts and also help determine the trends of the market. I hereby move ahead to present my homework submission based on the questions by our noble professor.
- Discuss your understanding of the ADX indicator and how it is calculated? Give an example of a calculation. (Screenshot required)
After taking my time to go through the lecture notes of our noble professor, I have gotten grab understanding of the ADX indicator as a great indicator which functions in the crypto market by determining the trend strength of a particular crypto asset.
The ADX is an acronym which means Average Directional Index, and was invented in the year 1978 by J. Welles Wilder who is one the a crypto analystist with great skills in the crypto market.
The indicator is an indicator which calculations is king of very technical but very simple to understand. The ADX indicator is used to make a determination of the strength of a trend.
It is a kind of oscillator also that is used in determining the strength of the trend and not the direction is moving towards to.
The ADX indicator has a range that is between 0-100 and this is what the strength of trend is based on. The ADX range has a meaning with every range, that is the range of the ADX has a meaning with regards to the strength of trend of a crypto asset.
The ADX Range and the meaning is been tabulated below for more clarifications.
| ADX Range Value | Meaning |
|---|---|
| 0-25 | The Trend is Very Weak |
| 25-50 | The Trend is Strong |
| 50-75 | There is a Very Strong Trend |
| 75-100 | There is an Extremely Strong Trend |
Moving further, the ADX is made up of three lines, that is the ADX line, the +DI line and the -DI line. These lines all come together to help in determining the trend of the crypto assets chart which is been worked on. Therfore combining these lines together will be able to detrinmine the price trend in a sense that as to it moving in a uptrend or downtrend.
Now when we take a look at the various meaning with regards to the values of the ADX indicator. it is indicating to traders or investors as to when to enter to to trade to that particular crypto asset. This will enable them to gain great amount of profit after entering into the trend. Also, with the values, traders are able to know as to which point or season when there is a trend and which point that there is no trend.
How is ADX calculated?
Calculating ADX is sometimes a little tedious and complex. There are some form of systematic calculations you need to follow and thus by using the formula.
How to Calculate the ADX
Step1
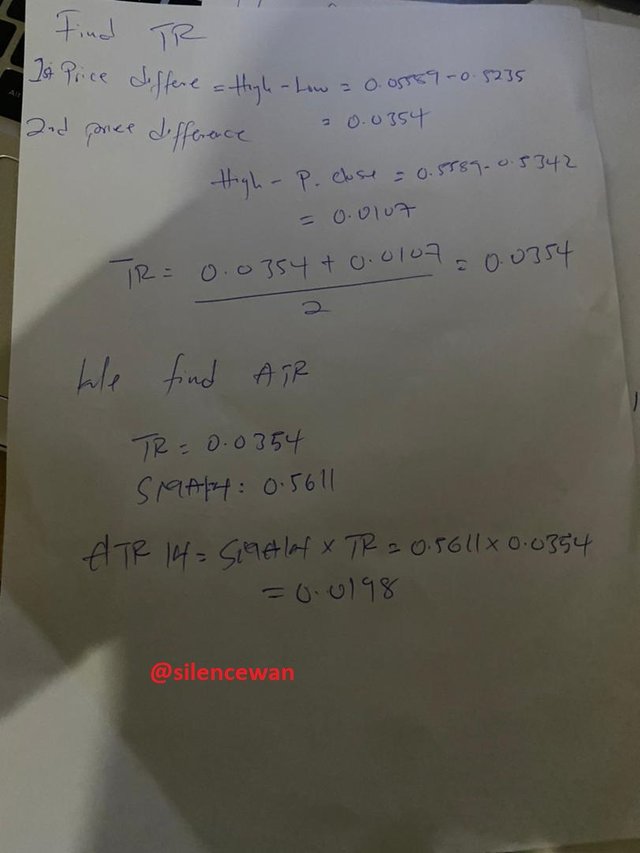
We will find the True Range first, that leads us to finding the Max value given from the price difference.

Step2
We then find the True Range. So in this case we have to find it from the Moving Average. 14 periods will also be taken into consideration.

Step3
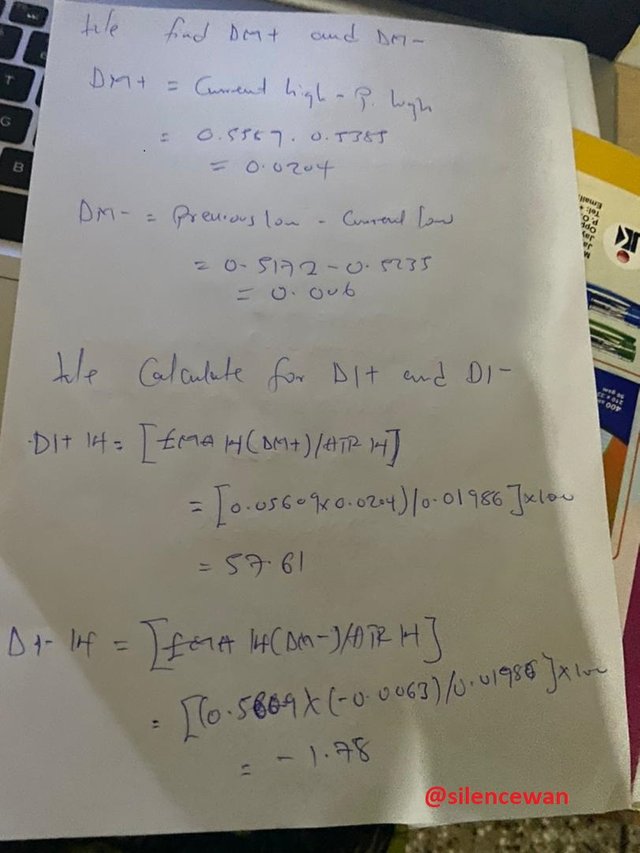
We will now calculate for the +DM and -DM values and the formula is given below.

Step4
We then find the DI+ and then the DI- through using the ATR. We also consider 14 periods.

Step5
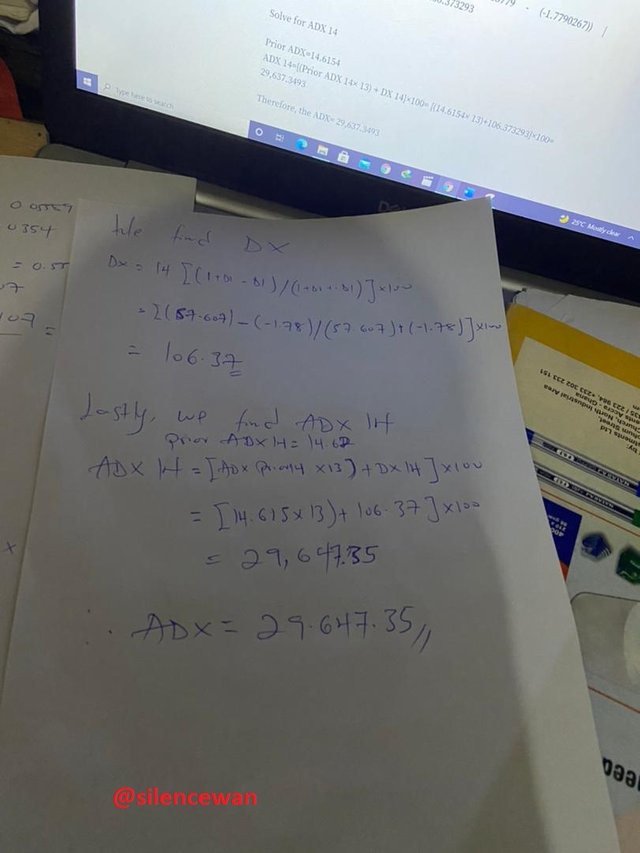
What we do next is to calculate for the Directional Index using the values obtain from +DI and -DI and it is seen below.

Step6
We now find the ADX from the steps given above and the formula given for the ADX

Lets take a scenario
Considering this data from a certain crypto asset
Current high= 0.5589 | Previous high=0.5385
Current low= 0.5235 | Previous low=0.5172
Previous day close= 0.5342
SMA 14= 0.5611
EMA 14= 0.5609
SOULUTION BELOW


Question Two: How to add ADX, DI+ and DI- indicators to the chart, what are its best settings? And why? (Screenshot required)
In this chapter, I will be teaching you how to add the ADX, DI+ and then the DI- into our chart with the help of using trading view.
- First of all you will visit the trading view website through tradingview once the chart loads you follow the process stated below.
- The next thing you will do is to select the function, which is labeled fx on the chart panel.
- You will have to search for the indicator Average Directional Index in the small window that will pop up on the chart window. You will have to select the one with ADX, DI+ and then DI-
- We now have the Indicator being added to our chart.
How to configure the ADX with DI+ and DI-
Lets look at the steps below to know how it is done.
- You will have to locate the ADX settings shown in the screenshot below and then click on it.
- There are three options on the settings. These are the inputs, style and then the Visibility. Where the inputs section, it gives you the chance to input your preferred values for the ADS Smoothing and DI Length. But by its default settings, they are both 14.
- Also, at the style section, you can change the colors of the ADX, DI+ and DI- lines. Set the precision to default.
- And the last one is the Visibility, the visibility section, leave the settings at default.
What are the best settings and why?
As I mentioned earlier while I was explaining the ADX, the default settings are always set to 14 periods. What this simply tells us is that, when taking a days chart, there would be a period of 14s and also an our chart would give a 14 hour period and so on. That is for the default settings.
But what we should know is that, there is a possibility of you setting it to what you want and working with it. But you must always be careful in this case. For shorter periods it may always lead you to false signals or giving you misleading signals. But using the longer periods always makes a smooth way for giving out good signals. Lets see how this is than in this two ways. for the short and then the long.
Let us use a length of 8
As shown in the above chart, you can clearly see that, for the short periods, it reacts very fast or quicker making a comparison with the longer length. As a result, you have seen clearly that there are a lot of misleading signals that occurs in the shorter periods.
Lets also talk about the use of the length of 30
We also consider using the longer length. We can notice from the chart above, it has already brought solutions to that of the shorter length. It is always advisable to use length of between 7 and then 30 for the longer length periods. What we must know is that, for cases where the lengths fall below 7, we can always have cases of misleading signals and when in turns out to be above 30, we can also turn out to loose out on signals. So it should always be between.
Question Three: Do you need to add DI+ and DI- indicators to be able to trade with ADX? How can we take advantage of this indicator? (Screenshot required)
The first thing we have to know is that, The ADX we already know that it is a good performing indicator in a sense that, when talking about detecting or showing trends of an asset, it performs so well by outlining the strength of the signals but as a matter of fact, the ADX itself cannot be used to determine directions of trends of assets. This is because the ADX is only an indicator that is used for measuring current assets strengths. So for this indicator to function well, there is a need to employ the the ADX alongside the + or - directional indicators. But also, there are other indicators that you can use this ADX with to also determine the directions of an asset.
So, we know that the DI+ and the DI- can aid traders to locate trends in an asset thus showing them the direction so it is indeed needed as part of the ADX indicator for a successful trade.
So I will be showing you a chart below, for only the ADX indicator, that will tell you that, the indicator only determines momentum and can not show trends. Lets see what happens below for only ADX.
How to take advantage of the indicator
Now lets see how we can take advantage of the indicator when we consider both the ADX and the DI- and the DI+ at the same time.
Now in the chart below, we can see clearly how the trader can take advantage of this combining the ADX and then the DI+ and then the DI-. You will see clearly that I marked out where there are possible buy signals as a result of the crossing of the DI+ which shows a buy signal in the chart and also where you see the DI- mark, it shows an exit signal in the chart. That is when the price of the assets is about to fall. So in short, these three together can help traders locate or find all the signals they need when trading.
Question Four: What are the different trends detected using the ADX? And how do you filter out the false signals? (Screenshot required)
We all know that, considering the ADX indicator, it is subjected or bounded to a 0-100 on scale basis. Between this range, we have what we call the strength trends, the No trend or week trend and then the strong trend and Extremely strong trend
Lets look at how trends are Detected by the ADX
- Weak or no trend.
So considering a plot of below a 25 mark, we can consider this actually to be a no trend or weak trend when looking a the market. SO what happens here is that, in cases where there are reversals of trends, what will happen is the ADX turns to decrease along the 25 mark, this continues until it falls below. So if this should continue, it will mean that, it will constantly decrease until we have a no trend or a weak trend.
You can see from above in the BTCUSD chart how the No trend or weak is formed in the ADX.
- Strong Trend
Also, when we consider plotting the ADX value between 25 and then 50. That is when we have the case of the strong trend that pops up in the market. Though the trends do not show up so strongly, but the fact that it shows up a little then we consider it as a strong trend.
The above chart of BTCUSD shows a strong trend
- Very Strong Trend
So we achieve the very strong trend when the ADX is plotted within the mark of 50 and then 75. This trend are actually shown to be very strong compared to the strong trends.
- Extremely Strong Trend
So basically, whenever the ADX line is able to move above the 70 mark we consider it as an underlying market which is an extremely strong trend. So in this regard, it is able to pull up a high volatility considering the market and this keeps going upwards as the volume keeps increasing.
Filter false signals with DI+ and DI- crossovers
The fact that whenever the DI+ crosses the DI- and also the DI- crosses over DI+ does not always mean that that either of them is a buy signal and then the other is an exit signal. Sometimes we do have cases of false signals from this indicator which is what I will expatiate in this chapter. So assuming there are always crossing that happens around the 25 market plot, we already know that these are week trends or no trend, so basically they will be false signals. Lets consider the chart below.
Question Five: Explain what a breakout is. And How do you use the ADX filter to determine a valid breakout? (Screenshot required)
I will be talking about breakout in this chapter. It can be explained in short as a period where by the price of an asset being considered in the market goes beyond its resistance and support levels. These kind of price movement cause lots of volatility in the market. But mostly, what causes this is as a result of an oversold and of cause buying over assets stated with little market capitalization. What we should know is that, there are cases of fake breakouts that can occur in the market. The most important thing to always consider is the movement of the breakout. For real breakout the price movement is always in the direction of the breakout. It moves along side. But like I said earlier, in the fake breakout the price would go opposite to the breakout.
A support breakout which usually occur as a result of oversold, the price breaks the initial support making it a new resistance and create a new support.
Above are charts of BTCUSD which shows the breakouts which is give by the ADX indicator. Like I mentioned earlier, you can see that in the charts above the breakouts where not formed when the lines were below the 25 mark but form above the 25 mark. So this means that breakouts forms when the DI- and the DI+ crosses the value of the 25 mark when it is considered with the ADX indicator.
Question Six: What is the difference between using the ADX indicator for scalping and for swing trading? What do you prefer between them? And why?
ADX for Scalping
We have already learnt what scalping is in our previous is, but I will like to explain it once more. What we should know about this is that scalping occurs when trading is done on smaller time frames, that is timeframes like 1 minute, 5 minutes and so on. What we should also know is that, the ADX indicator could have some kind of correlation with the use of scalping. That is on smaller timeframes. This could be done by the help of the DI- and the DI+ helping it form crosses that will be noticed and considered as buy signals and not false signals. Also looking at this two, it can also be used to determine trends and movement of the price of an asset. They are some concepts about this kind of indicator having unreliability due to the fact that using short lengths can give false signals but this could be avoided by using it along side some other indicators.
ADX for Swing Trading
Also, what we should know about swing trading is that, it is done when the asset is being held for some timeframe for some form of personal gains and then on short term basis. It is know that, the appropriate timeframe for this is mostly 30 mins, an hour or 4 and then sometimes a day. Using ADX for the swing trading can be effectively used when you use it along with other indicators. Such indicators like that of the PP (Pivot Points) and others like the Ichimoku. This way, traders can actually locate the correct entry points in a trade.
Difference between ADX for scalping and swing trading
Talking about the difference between the ADX in scalping and swing trading is that, when doing scalping under shorter timeframes the ADX indicator is always at a good help. It aids you to relegate false signals in the trend and helps you locate the correct signals while that of swing is the fact that the ADX indicator always helps it confirm the correct and right entry.
What do I prefer and why?
I personally will prefer the ADX with the swing trading since the ADX indicator is always there to confirm the signals, that means that it is able to relegate bad signals and focus on correct signals.
This was a wonderful topic. I have learnt a lot from this weeks lecture. The ADX is really indeed a great indicator. Even though there are some challenges it faces, but the fact that it goes with some form of scalping trade and swing helps it locate correct signals in the market that will be in favor of traders.
All in all, the lecture was a great one and I really want to thank the professor for the choice of topic for the week.


Hello @silencewan,
Thank you for participating in the 7th Week Crypto Course in its third season and for your efforts to complete the suggested tasks, you deserve a 9.5/10 rating, according to the following scale:
My review :
Very excellent work which covered the subject in all its aspects in a superb manner and with a solid methodology. Most of the answers were precise and direct.
A good and deep explanation of ADX indicator with a great effort to interpret its complex method of calculation.
In the last question, your answer was general, you did not go into details and did not provide some illustrative examples.
Thanks again for your effort, and we look forward to reading your next work.
Sincerely,@kouba01
Downvoting a post can decrease pending rewards and make it less visible. Common reasons:
Submit
Thanks so much professor. I’ll take note of all said.
Downvoting a post can decrease pending rewards and make it less visible. Common reasons:
Submit