Hello everyone, I will like to say that I am much excited to partake in this last episode of the steemit crypto academy causes. I will like to thank the professor for the choice of topic. Which is the KDJ Indicator. Without wasting much time, I will like to delve into the subject matter.
In your own words define the random index and explain how it is calculated
In this chapter I will be explaining what a Random index is which is also know as the JDJ Indicator. Talking about the KDJ, it is a tool, a technical tool that aids traders in making predictions to price changes in the market considering some certain amount of time. Most people say that, the KDJ is a more useful and practical indicator. The KDJ is made of lines and these lines are three, which are the D line, the K line and that of the J line. So basically it is all about helping traders to locate trend reversals for and and sell of crypto assets.
Another important factor about the KDj is that, it would have been like that of the Stochastic indicator but there is a little change here. There has been some form of upgrades. That of the Stochastic indicator has got two lines which are the K and that of the D while in the KDJ is made of 3 lines. Already I stated.
All these lines have the individual roles they play which I will like to state emphatically. That of the K line which is referred to as the K5 when talking about the stochastic Indicator shows traders in cases where we have an overbought or oversold in the price of an asset. What we have to get here is that, both the K and that of the D lines has some kind of connection like that of the stochastic Indicator, So the J line which has been introduced in the KDJ is the line that represents a form of divergence in the D line from that of the K line ( Values when considered). As I said earlier, this two moves together to bring out trends that represents either a buy or a sell. So the lines involved in the KDJ indicator stands out alone but works together to achieve a common goal thus, helping in the prediction of the price f an asset and determining trends.
How The Random Index Is Calculated
In other to calculate the Random Index, you must first of all have to get the highest, that of the lowest and also the closing price of the period take, taking n as the price and also the RSV. Lets define the parameters.
- Hn - Highest price of a certain day
- Ln - Lowest price of a certain day
- Cn - Closing price of a certain day
What we have to do next is to calculate the RSV value from the formula
RSV of the day= (Cn-Ln)/ (Hn-Ln) X 100 (where the values always ranges from 1 to 100)
The next thing you have to do is to we calculate the value of K
K value = (2/3 x K value of the previous day) + (1/3 x RSV value of the day)
We further move on to finding the D value
D value = (2/3 x D value of the previous day) + (1/3 x K value of the day)
The last thing we do is to also find the J value
J value= 3 X day K value- 2 X da D value
Important note here, for cases where there are no K and then D values for the previous day, the user can always use 50
This Indicator could be used for short time frames and also half time(medium) timeframes
Is the random index reliable? Explain
Asking if the Random is Index is reliable, I will say that, of all the indicators we know, not even a single one of them is 100% correct or give accurate results. But when paired sometimes could always be in great advantage. So basically we know that, the KDJ helps traders determine trends since is one of the trend analyzing technical indicators. So looking at what I have explain, the Random Index cannot not give all the desired trends traders will be looking for, but it can be used along with other indicators like that of the ADX, the moving averages or even the ATR which we have learnt with professor @koub01. So I will just say that, the KDJ cannot not be reliable when used alone since it also gives false signals sometimes. So traders looking out to make big time profits should do their analysis well by using other indicators with the KDJ before making their trade.
Adding Random Index To A Chart.
In order to add the Random Index Indicator to charts, the steps below should be followed
- First of all visit the trading view site through searching trading view in google and then clicking on the first link.
- On the main window, or the homepage, you you will click on chart.
- Now our chart window is opened. We can now proceed to talk about how to add the Random Index.
- So the first thing you do is to Click on fx indicators at the top of the chart
- You will have to search KDJ in the search box that pops up and then click on KDJ by LL21LAMBOS21
- We can Now see clearly the KDJ added to our chart below.
- In Here I have indicated all my lines clearly. You will know what the K the D and the J lines look like.
Parameters Of The Random Index.
- Uptrend, buy signal or golden fork. We can do this in 3 different ways. One is, when a cvase where we observe that the J line has fallen below 20% in the KDJ indicator, we can consider or have a buy or uptrend signal. But this is not preferable. It delays sometimes so you might make looses. Alos, you can also notice in the chart below that, all uptrend signals falls in the green boxes.
We should know that, when the J line moves across the K and that of the D lines giving a three point of intersection and the uptrend or buy signals will be given when the J line crosses that of the K and the D lines. So you can see in the chart above that, I have indicated the intersection points and where the buy signals are formed.
Downtrend or sell signals or dead fork.
This is also like that of the uptrend. It is also spotted in three different ways. That is the crossing of the lines, also, when the J line increases above 80% is another way and lastly, the sell zones are always indicated in red boxes.
You can see clearly how the crosses of the J line crosses the other two downwards. This indicates a sell signal.
Now lets talk about Oversold and then Overbought.
Oversold zone
As we know already, oversold is identified when the is a fall of 20% of the J line in the KDJ. It is also identified with the help of the buy signal process. When we see cases like this, it means that most of the traders are releasing their assets. They intend selling them. So at this point, it is always good to buy and hold the assets since they are selling.
overbought zone
It is the same process as I have explained. You will know when the J line increases or spike above the 80% mark level of the KDJ. In trading, cases where there is an overbought of an asset, always gives the opportunity to keep the assets, at that point, a lot of people are buying the assets which could lead to profit making.
Differences Between KDJ, ADX, and ATR.
KDJ
So basically, the KDJ indicator is also used in technical analysis. But in its case, it shows the zones of overbought assets and oversold assets. What we also know about the KDJ is that, an overbought of an asset is always shown when the K line increases above 80% and also we realize the oversold when the K line cross below the 20% level. This is how the tool is used to determine trends of assets. So for traders to always be sure of what they are landing to, it is always advisable to pair along with other indicators.
ADX
Lets talk about the ADX which means Average Directional Index. This indicator again was treated with professor @kouba01 in one of his lectures. It is a technical indicator, that plots trends of the assets we consider dealing with. But mind you, this determines the trend of assets and it ranges from 0 to 100.
I will add the ADX to the chart so you can see how it also looks like with that of the Random Index
The different ADX range values and their meanings have been put in the table below.
| ADX Value | Trend Strength |
|---|---|
| 0-25 | No trend or very weak trend. |
| 25-50 | There's a trend or strong trend. |
| 50-75 | Very strong strong. |
| 75-100 | Extremely strong trend. |
ATR
ATR simply means Average True Range Indicator, which is also another indicator that is used to determine volatilities. When talking about volatility, we talking about the amount the assets has fallen or increased. So basically, that is what the ATR is used for.
I will also add it to the chart, then we see how they both will look like on the chart.
KDJ, ADX and ATR
Lets talk about the Difference between The KDJ, The ADX and that of ATR
| KDJ | ADX | ATR |
|---|---|---|
| Involvement of three different lines. K, J amd D | Use of Just 1 line. | It also has just a single line |
| The use of KDJ is determine if an asset is either overbought or oversold. | ADX deals with the strength of the trends. That is what is designed for | The ATR deals in volatilities. Measuring volatility of assets. |
| KDJ shows the direction of price | This does not show price direction | ATR does not also show price directions. |
| The levesl included in this are 20% and the 80% | The levels in ADX ranges from 25 to 100 | Periods most approriate are 10 and sometimes 14 considered. |
Use the signals of the random index to buy and sell any two cryptocurrencies. (Screenshot required )
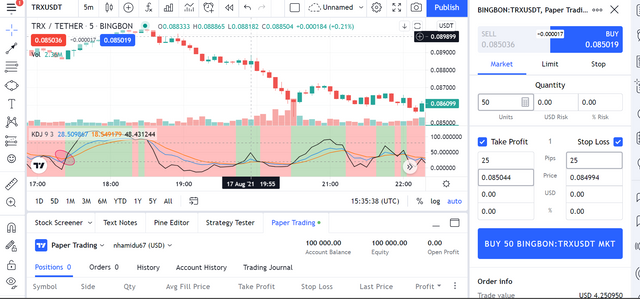
I will buy 50 TRX using the TRX/USDT parir in the trading view demo account.
I launched my TRX/USDT chart and selected a 5m time frame.
So I added the KDJ indicator and identified the point at which TRX
was entering into an uptrend. I have circled that point in the screenshot below.
So basically, I selected a very notable sell buy which is also an uptrend in the chart, So I have indicated it in the chart above. I bought 50 TRX so I had to set my quantity I needed and also set my profit and then set my loss as well.
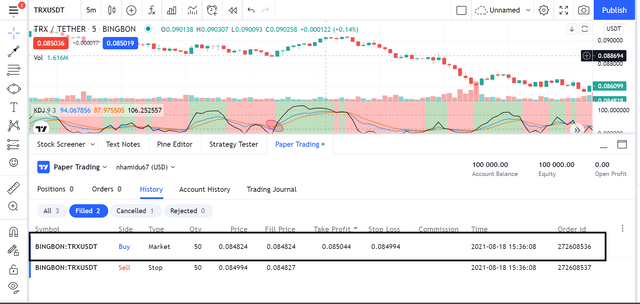
So after which, I placed an order of the trade. I also place a buy limit order filled at $0.08651 a stop loss of $0.08610 and a take profit of $0.833.
So I am therefore buying 50 TRX at a price of $ 4.3250
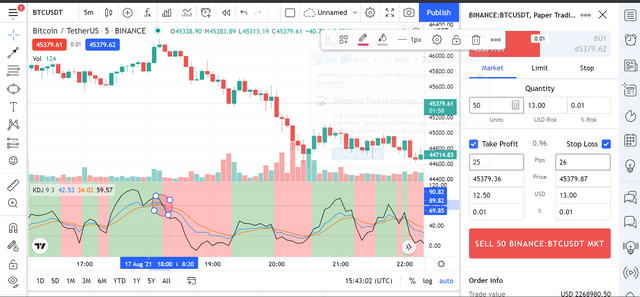
So I will be selling 50 BTC next
I was able to identify a sell signal as shown in my screenshot with the circled part and placed a sell order. Lets check something.
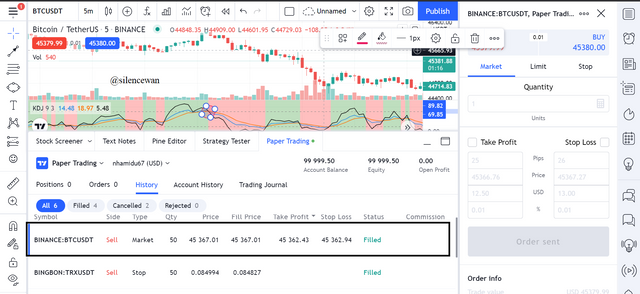
So I then set the quantity I am selling and then hit the sell button.
You can see and check clearly from the above screenshots from there trading view app, I was able to place the demo trade of two cryptocurrencies which is the TRX and that of BTC. I have successfully bought and sold TRX and BTC. All the details for that task is shown above in the charts.
Conclusion
First of all, I will like to say a very big thank you to the professor @asaj for the choice of topic for the week. It was really great exploring the KDJ indicator.
I haver learnt a lot from this lecture, the lines of the KDJ and how they work together to form trend movement. I have also learnt how KDJ could be best worked with other indicators like the ADX and that of the ATR.
Also, I stated emphatically the difference between the indicators mentioned and we saw how they both are different. The last thing I will like to talk about is the demo trade that I made on the TRX/USDT and also BTC/USDT. I was able to make a buy order on TRX and a sell order on BTC,
All said above, I will like to thank everyone, my colleagues and the professors for this last week of the crypto academy. I hope to seeing you in the next season. Thank you.


