Hello everyone, it is an exiting week, exiting because this is the last week of the steemit crypto academy for season 3. I would like to thank the professor for the great works done. This week with the professor is all about Trading Sharkfin Pattern. I will be making my submissions based on the question that has been asked by the professor.
Question One: What is your understanding of Sharkfin Patterns. Give Examples (Clear Charts Needed)
In this chapter I will be talking about the Sharkfin Patterns and I will also be giving you some examples on charts how they look like.
Basically sharkfin patterns talks about trend reversals and price movement in various directions in the crypto market. In the crypto market there are so much uncertainties and some of these uncertainties mostly happen to cause changes in the trend of a crypto asset. So what happens is that, cases where the movement of price forms sharply could lead to we detecting the idea of the sharkfin patterns. These Trends happens when investors or traders makes a lot of buys and sells in the market, there is always a rise and fall of the assets in the market. So all what we should know is that, price volatility can lead to the formation of reversal patterns that are v like in shaoe and also inverted V like shape patterns. This is the whole idea of the Sharkfin patterns.
Talking about the two types, the V-shape pattern and that of the Inverted V-shape Pattern. What happens is, we know that most reversal happens around the support and that of the resistance levels in when considering a crypto asset. So for the V- shape patterns it mostly happens in uptrend reversals and for that matter, there will always be a formation of the V shape pattern around the support level of the asset. I will give an example in the chart below. I will be using the ETH/USDT chart under a 1 day time frame.
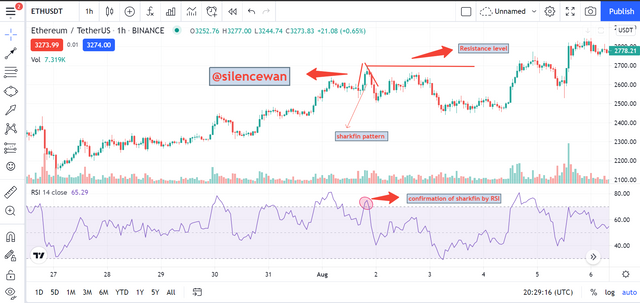
Now, talking about that of the inverted V shape pattern, this occurs at the at the resistance level in the price of an asset. This forms at the point where the price spikes and then there is a sharp fall. This kind of trend reversal will always lead us to the inverted V shape sharkfin pattern. Below is an example. The same ETH/USDT chart under a 1 day time frame.
Above are the chart showing how the sharkfin patterns looks like. Both the V shape sharkfin and that of the inverted V shape sharkfin patterns all described in the images provided above.
Question Two: Implement RSI indicator to spot sharkfin patterns. (Clear Charts Needed)
In this chapter, I will be showing you how to implement the RSI indicator into the sharkfin patterns. Lets see how this is done. I will be doing this practical with the help of the trading view site. So what you will do is to visit the site.
But what we have to know is that, of all the indicators thought and in the world, there is no one of them that works 100%. At least there are always some lags or set backs. But considering the sharkfin patterns and the RSI, the RSI could have more importance here, good results can be gotten if the RSI is set to the default settings with the length of 14 normal and the the bands as 30 and then 70. That is the upper, the middle and that of the lower bands.
Before we proceed, lets see how it is added to the chart
- You search Trading view in in google and then select the first tab.
- Once you have the landing page of the Trading view, you will click on chart.
- After the chart window opens, we then find the fx function
- After clicking on the fx function, a window will pop up
- Search RSI in the window that pops up and the click on the RSI.
- We have our RSI added to our chart.
Lets also check if our parameters are properly set
- You will have to click on the settings button on the RSI located at the left hand side of the window
- After it opens, you see the first page of it, which is the inputs, where you can set the lengths
- In the style, you can also set your bands.
Lets see an oversold and overbought of assets in the chart below with the RSI and that of the sharkfin
In the case of other, the RSI probably might show the reversals in the trends but when using the RSI in sharkfin, we see that it is shown in the overbought and the oversold regions where there is a very sharp reversal at the levels set as our default, that is the 30 and the 70.
Lets see how Sharkfin and RSI in Uptrend Reversal Occurs
So here, we would notice a rise in the 70 band level of the RSI and also a very quick fall below the 70 band level. once this happens, we could have a case of seeing an inverted v shap sharkfin pattern.
In an uptrend reversal, the RSI should rise above the 70 band level and quickly fall below the 70 band level again. The quick fall below the 70 level is the quick reversal from uptrend to downtrend. Lets involved a little praticle to explain better how the pattern is formed for uptrend v shape sharkfin patterns.
I will be using chart of TRX/USDT on a days timeframe for this practical.
We also do for Sharkfin and RSI in downtrend reversal
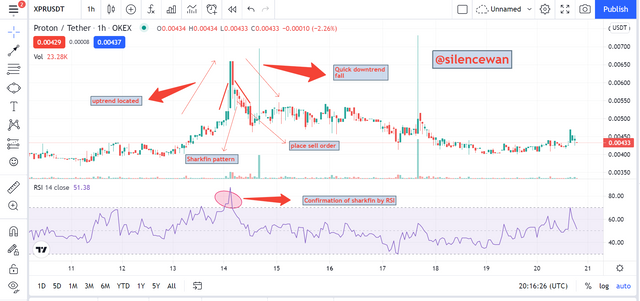
So what happens in the downtrend is that, we will notice that the RSI bands will fall below the 30 band and there will also be a very quick spike above the 30 band level. This kind of reversal is where we can generate our sharking patterns from. Lets follow this with some practices, this will give a clear understanding.
I will be using the same chart of XPR/USDT on a days timeframe for this practical.
Observe something in the chart above. The point that is confirming the sharkin by the RSI, you can see that there is a fall of the price below the 30 band and another spike above it. This confirms that both agree to their syntax. Likes in the case of the uptrend. It is the same case.
Question Three: Write the trade entry and exit criteria to trade sharkfin pattern (Clear Charts Needed)
Sharkfin pattern Trade Entry Criteria
Lets see how we can use the RSI along side sharkfin pattern in the trade entry criteria for both buying and selling.
Lets Consider the Buy entry criteria
The first thing that should be done is to add the RSI in the chart (any selected crypto pair), after which you will have to live it to its default settings.
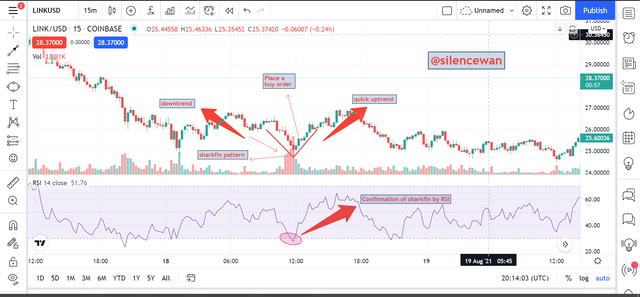
In order to indentify the formation of sharkfin pattern, we will have to look clearly to get the point at which there is a quick trend reversal, thus there should be a downtrend and a very quick uptrend reversal forming a V shape which is the sharkfin pattern.
So to justify that we really have a sharkfin, we will then confirm it by using the RSI, thus we check to see if the price has fallen below the 30 band level and a spike above the 30 band level. This will clearly confirm that.
The next thing to do is to place your order if you are satisfied with the formation confirmed by the RSI.
A clear example below
Lets Consider the Sell entry criteria
The first thing that should be done is to add the RSI in the chart (any selected crypto pair), after which you will have to live it to its default settings.
In order to indentify the formation of sharkfin pattern, we will again have to look clearly to get the point at which there is a quick trend reversal, thus there should be an uptrend and a very quick downtrend reversal forming an inverted V shape which is the sharkfin pattern.
So to justify that we really have a sharkfin, we will then confirm it by using the RSI, thus we check to see if the price has risen above the 70 band level and a fall below the 70 band level. This will clearly confirm that.
There will be a formation of an inverted V shape in the chart confirming the sharkfin
After you are curtained with you analysis, you can place your sell order
Sharkfin pattern Trade Exit Criteria
Here I will talk about the exiting trade orders which we place for both sell and buy orders. This is done by setting a stop loss and also setting a take profit and to do that, we need to follow the following procedure I will give below.
Exiting Buy Trade Order
The first thing we need to know and do is that, we have to set our stop loss level. Sometimes trades could go wrongly not as planned, so should in go in the wrong direction then we can exit from the trade when our stop loss set is being hit.
The stop loss price must be set just below the the sharkfin pattern that is the rejection low which forms the V shape of the patter.
Also, we set our Take profit price. It should be set in contrary to the market price of the asset. the most appropriate is always at 1:1 risk reward
Lets see a clear example below. I will set my stop loss and take profit in the chart below.
Exiting Sell Trade Order
We again have to set our stop loss level. Sometimes trades could go wrongly not as planned, so should in go in the wrong direction then we can exit from the trade when our stop loss set is being hit.
The stop loss price must be set just below the the sharkfin pattern that is the rejection low which forms the inverted V shape of the patter.
Also, we set our Take profit price. It should be set in contrary to the market price of the asset. the most appropriate is always at 1:1 risk reward
Lets see again a chart below
Question Four: Place at least 2 trades based on sharkfin pattern strategy (Need to actually place trades in demo account along with Clear Charts)
I will be using Trading view for this task, I will place a demo trade on the two crypto assets.
I will be buying 200 Dogecoins
The first thing I did was I opened the crypto pair, DOGE/USDT and spotted my sharkfin patterns which V shape.
What I do next is that, I will add the RSI to the chart to confirm my sharkfin pattern, which is the V shape. It was clearly confirmed when the price fell below the 30 band level and a spike above the 30 band level.
So I will have to input my buy price, also input the quantity that I want to buy, set a take profit and stop loss before i buy the asset.
Take Profit set to 60 (0.30908)
Stop loss set to 60 (0.30829)
My Order was placed with a 1:1 R:R
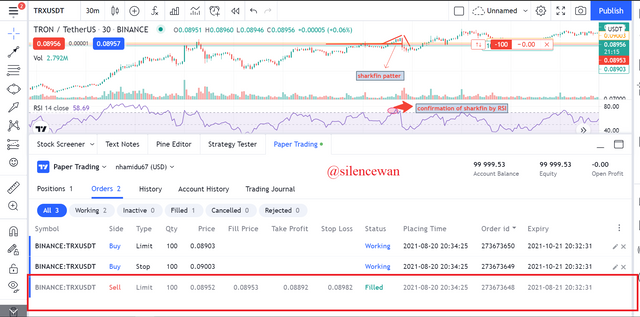
I will be Selling 100 TRX
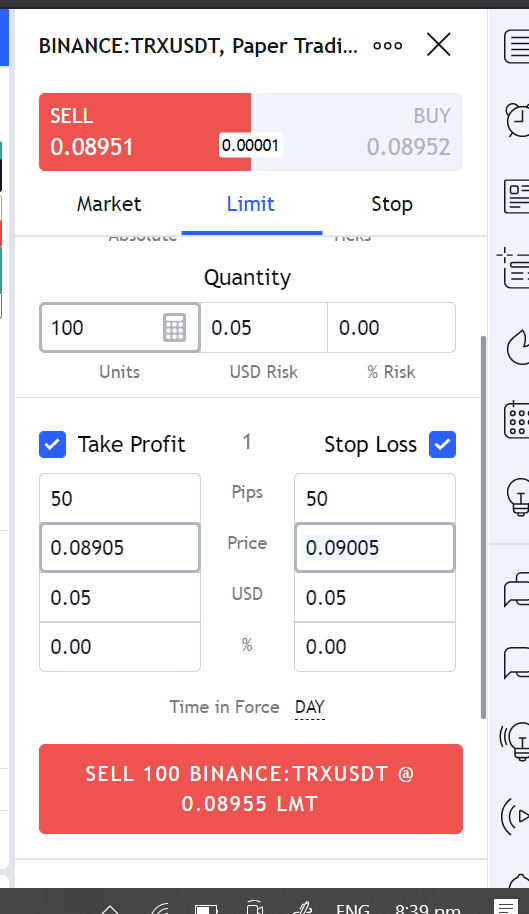
- I will select the crypto asset which is TRX/USDT, after which, I have to identify the sharkfin pattern and also add up my RSI. Once that is done, the the RSI will confirm the inverted V shape of the sharkfin pattern.
The RSI confirms it by the spike of the price above the 70 band level and a quick fall below the 70 band level.
I will now use the demo trade to place my sell order
I am selling 100 TRX at a price of $ 0.08955, my
Take profit was set to 50(0.08905)
My stop loss at 50 (0.09005)
Order was placed with 1:1 R:R
Conclusion
I will conclude by sayin that, the lecture was a great one and I really want to thank the professor for the great choice of topic for this week.
Sharkfin is really a great way of analyzing crypto assets in the market before any trader would go into selling or buying an asset. It is simple to understand and does not require any form of critical thinking in analyzing the charts with it.
The point is that, you only have to locate where there would be formations of V shapes or inverted V shapes. That is how you can know your sharkfin patterns.
With the help of the RSI will just make the work much easier here. The RSI is there to confirm the trend reversals of the sharkfin patterns. The RSI is confirms the shark patterns by the help of the 30 and the 70 band levels. Thus, for the 30, when there a downtrend and a quick uptrend reversal, there is a sharkfin that is formed which is confirmed by the RSI.
Also for the 70 band level, it is confirmed when there is an uptrend and a quick downtrend reversal, this confirms that by the RSI.
Thansk to the professor and to my colleagues, I hope to see you all next season.


