Background Image design using canvas

Hi steemians,
Welcome to the first week of the engagement challenge for season number 4. This week, we have a unique and important topic to discuss which is Crypto Market Technical Analysis. This is a major aspect of the crypto market which every trader takes much into consideration before performing a good trade.

How would you define Technical Analysis in the Crypto ecosystem? Mention its Importance.

The crypto market is never a stable one. It is a highly volatile market. Hence to be able to predict the price movement of the asset we need a method and this method is called technical analysis.
When we talk about the word technical analysis, we are referring to the method used to determine the movement of the market or the direction in which the market is taking. Technical analysis is only effective with the help of some data since the market is highly volatile.
To perform a technical analysis properly, the data of the price and the volume in the past has to be taken into consideration. It is believed that this market movement is repeated hence whenever a particular movement is spotted, the past movement that looks like it can be traced to see how the market will move afterwards.
The technical analysis encompasses a lot such as chart patterns, indicators, trend lines, support and resistance levels etc, just to mention but a few. These are methods that are employed to determine the direction of the market after taking into consideration some factors that guide the above listed.
Importance of technical analysis
The importance of technical analysis can be seen below.
One of the most importance of technical analysis is that it helps traders to predict the movement of the asset.
Technical analysis like the use of indicators goes a long way in alerting traders about a new signal in the market.
Technical analysis uses data history to perform its analysis and prediction and that helps traders to know what exactly happened in the market before they came.
Technical analysis helps traders to take advantage of the little chance the market offers especially short-term traders, they can enter and exit the market with proper risk management as given by the analysis.

Do you have practical knowledge of how to conduct technical analysis? Highlight some of the components of Technical analysis.

Yes, I have practical knowledge of how to conduct technical analysis. All analysis I have been doing as a trader for more than a year now is completely on technical analysis. The reason is that I consider this method quite practical and have mathematical proof that backs them up.
Components of technical analysis
The following are a few components of technical analysis that I normally take into consideration.
- Charts Pattern
- Indicators
- Price and Volume
- Support and Resistance level
Charts Pattern
The major place where technical analysis begins is on the chart. Charts give information regarding the past and current movement of the asset in real life. There are different types of charts used in technical analysis among which include Heiken-Ashi, Line charts, Bar charts, Japanese candlestick charts etc.
When we talk about patterns of the charts, we are referring to a formation that the chart has made. This formation tells the trader if the price is going to increase or decrease. Over the years a lot of patterns have been formed and records have been documented in that regard. Some of the pattern forms give the trader who might have studied it previously first-hand knowledge of what is going to happen in the market in future.
Indicators
Indicators are another important tool used for technical analysis because it uses historical mathematical calculated data such as the previous price of the asset, the volume, momentum and many more to determine the movement of the asset at any point in time. The indicator gives information about when the price elasticity has reached, and when to enter or exit a trade. I will explain more in detail in the next question.
Price and Volume
Price and volume also play a significant role as one component of technical analysis. Whenever we notice an increase in the price of an asset and also an increase in the volume of the asset, we know that the said market is bullish, that is to say, more buyers are in the market at that moment. In the same way, if the price of the asset is seen decreasing with an increase in the volume of the asset, we know that the said market is bearish, that is to say, more sellers are in the market at that moment.
Support and Resistance level
Another important component of technical analysis is the support and resistance level on a chart. At the support level, buyers are in charge of the market which means the demand for assets at that point is high giving room to increase in price I.e the price moves in the bullish direction.
In the same way, at the resistance level, sellers are in charge of the market which means the supply of assets at that point is very high giving room to a decrease in price I.e the price moves in the bearish direction.

What do you understand by technical indicators? Do you consider them effective for trading cryptocurrency? Which one is your favourite and how does it work? (Screenshots required where necessary)

Technical indicators are tools that use the historical data of an asset such as price, volume etc to predict the future movement or price which the asset will attain in the future. It has mathematical proofs following the demand and the supply of the asset.
The technical indicator gives traders an overview of what they should expect when it comes to price movement in the future. Though sometimes this information may not be correct because the indicator is not 100% efficient.
Technical indicators are of different types and hence they serve different purposes. Some are used to predict price movement whereas others are used to predict the amount of volatility of the market at any point in time.
Do you consider them effective for trading cryptocurrency?
Yes, I consider technical indicators effective for trading cryptocurrency but I don't have 100% trust in them because sometimes they mislead traders using false signals or sometimes the signal they give will be very unclear leading to a loss by traders.
So I prefer users use indicators with another technical analysis tool as I have mentioned a few of them above. For a trader to carry out any trade, he or she should ensure he has confirmation from the indicators and other technical analysis tools used on the chart.
Which one is your favourite and how does it work? (Screenshots required where necessary)
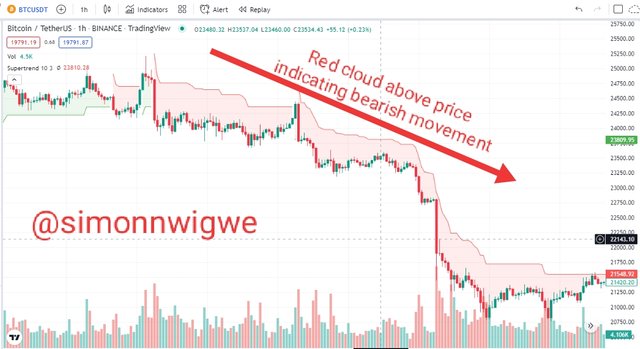
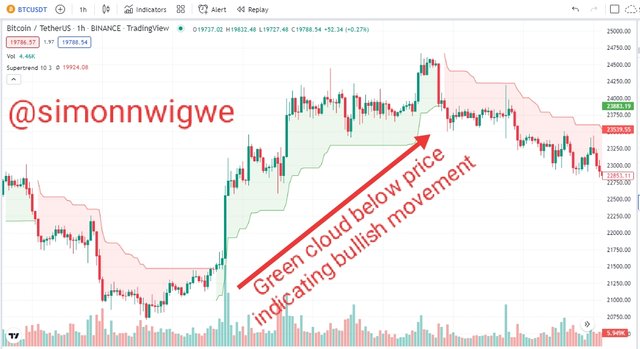
My favourite indicator is the SuperTrend indicator. This is an indicator that helps traders to keep track of the direction of the trend at any point in time. The indicator is very easy to use as it is in the form of a cloud and has two different colours red and green.
When the cloud is red, it is an indication that the price of the asset is decreasing, which is a bearish movement. This cloud then appears at the top of the price action. This is an indication that sellers are in control of the market and the amount of supply exceeds that of demand. An example can be seen in the screenshot below.

Bearish movement by SuperTrend indicator Trandingview.com
On the other hand, when the cloud is green, it is an indication that the price of the asset is increasing, which is a bullish movement. This cloud then appears at the bottom of the price action. This is an indication that buyers are in control of the market and the amount of demand exceeds that of supply. An example can be seen in the screenshot below.

Bullish movement by SuperTrend indicator Trandingview.com

Highlight the advantages and disadvantages of technical analysis. What's your advice to anyone about it?

Advantages of Technical analysis
There are many advantages associated with technical analysis and a few of them are listed below
The movement of the price of an asset is mostly ascertained via the technical analysis
Technical analysis helps the traders to place a proper risk management system to avoid losses
Technical analysis helps a trader to know when to enter a trade and make a profit
Technical analysis gives the trader firsthand knowledge about the outcome they should be expecting based on records.
Disadvantages of Technical analysis
There are many disadvantages associated with technical analysis and a few of them are listed below
Technical analysis does not take into consideration fundamental analysis which is one of the strongest factors that affects the price.
Technical analysis needs an expert explanation for any other user to work with because different technical analyses have different ways of operations
Technical analysis like an indicator can signal some false signal leading the trader to enter a trade at the wrong time leading to much loss.
No technical strategy is 100% effective hence a lot of different technical analysis needs to be combined to get a more reliable result.
What's your advice to anyone about it?
My advice is that everyone who makes use of technical analysis should take into consideration all the advantages and disadvantages I have listed above and even more. More also, before concluding on any trade decision, different technical analyses should be used to confirm it first. For example use at least two indicators and chart patterns or volume and price patterns combined.
You only conclude when all of them agree. Also, try to use different time frames to confirm your signal before entering the trade. Finally, I advise users not to start real trade from the beginning, they should practice and learn more using a demo trade. Apply all the technical analysis you have studied and see the result you will get in the demo trade, if the result is good enough then you can go ahead to perform real trade.
Also, ensure you are trading with what you can afford to lose. Don't use all your capital to trade only trade with what you can afford to lose and put a proper risk management system to protect your account from liquidation.

Conclusion

Technical analysis is a major part of trading and it has been used by many. Truth is that a lot of people don't consider other means of analysis before carrying out their trade they only focus on technical analysis. There are also some benefits and some effects of this technical analysis as I have explained above. For a trader who wishes to be successful, he should take into account other forms of analysis as well before taking any trade decision.


Good afternoon friend,
This is one of the benefits of technical analysis, it's really effective in this aspect because it helps traders know when to leave and enter the market without losing asset.
Although it's not 100% assured but it's really helpful to a lot of cypto trader.
Thank you very much for educating us
wishing you success
Downvoting a post can decrease pending rewards and make it less visible. Common reasons:
Submit
Indicator help a lot in identifying signs such as support and resistance, breakouts, reversal trend and a lot.
These levels play important role in trend identification, it determines either the market with continue or take a reversal trend.
I have used this indicator once in an assignment of one of the professors. My favorite indicator is the Ichimoku cloud which help spot a lot of market signals.
Great write up buddy and good luck.
Downvoting a post can decrease pending rewards and make it less visible. Common reasons:
Submit
I loved the information you shared with us regarding the technical analysis that is essential to handle for any trader who wants to make this a source of income. I did not know about this SuperTrend indicator, thanks for sharing how to use it.
Downvoting a post can decrease pending rewards and make it less visible. Common reasons:
Submit
Crypto slots https://similar.casino/review/energycasino
Downvoting a post can decrease pending rewards and make it less visible. Common reasons:
Submit
Downvoting a post can decrease pending rewards and make it less visible. Common reasons:
Submit
Thank you @franyeligonzalez
Downvoting a post can decrease pending rewards and make it less visible. Common reasons:
Submit