
Hello guys,
It's been a while since I wrote in this amazing community due to too much commitment which I found myself in this past few weeks. Am also glad that I have been able to resolve my issues and today I am back to continue with the Academy. Today I want to attempt Task number 10.

QUESTIONS
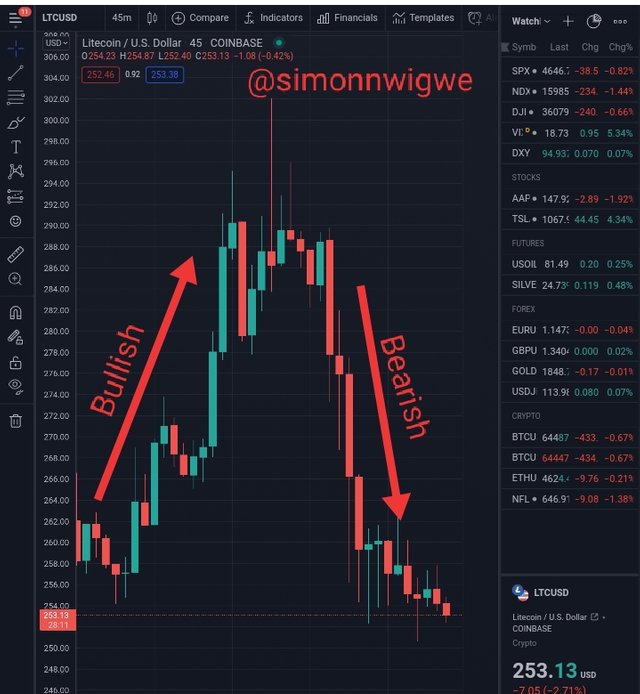
1a) EXPLAIN THE JAPANESE CANDLESTICK CHART?(Original screenshot required)
1b) IN YOUR OWN WORDS, EXPLAIN WHY THE JAPANESE CANDLESTICK CHART IS THE MOST USED IN THE FINICIAL MARKET
1c) DESCRIBE A BULLISH AND A BEARISH CANDLE. ALSO, EXPLAIN ITS ANATOMY. (Original screenshot required)

EXPLAIN THE JAPANESE CANDLESTICK CHART?(ORIGINAL SCREENSHOT REQUIRED)


Source
One of the most used Chart as far as trading is concern is the Japanese Candlestick Chart. This chart is used in analysis by traders to be able to determine the movement or flow of the trade. The Japanese Candlestick helps traders to understand when the market is in buy state and when it is in a sell state. It is important to mention here that the origin of this amazing tool came from a rice trader that goes with the name Munehisa Homma. The publishing of the said tool was then carried out by a broker that goes with the name Steve Nison.
The establishment of the Japanese Candlestick chart has helped traders in no small way to understand the movement of the market by just mere looking at the chart. As we know the chart can be made up of two different colours, one will be for buy signal and the other for sell signal. So when u see the market chart carrying the colours for buy signal you will be able to identify it and when you see the chart carrying sell signal you will also be able to identify it.
As I have earlier said, one of the most used chart is the Japanese Candlestick chart. Now, the reason why most traders prefer using this chart is that it is easy to understand and can be used by even a newbie in the crypto world today. The chart is also used by those who have some knowledge on trading to determine the next move of the market. This means that the chart aids proper prediction of the movement of the market.
The basic information which we can always see using the Japanese Candlestick Chart, that tells us if the market will be bullish or bearish include the opening, closing, low and high. To be able to determine the bullishness of a trend, you will notice that the close price is going higher than the open price and in that case the candles will be green which is used mostly to indicate the bullishness of the market. In the same way, when the close price is lower than the open price, it is an indication that the trend is bearish and in that case, the candlstick will be red indicating bearishness of the trend.

IN YOUR OWN WORDS, EXPLAIN WHY THE JAPANESE CANDLESTICK CHART IS THE MOST USED IN THE FINICAIL MARKET

The reasons why the Japanese candlestick chart if often used in finicial market are numerous, but for the sake of this studies, I will be mentioning but a very few. Let's get started.
Firstly, as I have mentioned above, it can easily be understood by everyone including newbies in the crypto world. A mere look at the chart tell us if the market is bullish or bearish in nature by the two different colours it possess.
Secondly, those who have studied deep in this type of Chart find it very easy to make prediction for the future. This is because after looking and the movement of the trend they can be able to tell whether the trend will continue or it will reverse.
The Japanese Candlestick chart also gives detail explanation about the market movement at any point in time. This means that any information that you need concerning the market at any point in time can be seen or gotten using the Japanese candlestick chart.
The Chart also signals traders on when to buy or sell their asset. This type of chart if well understood helps traders to minimize their losses because they will only sell or buy at the right time.
With a look at the colour of the Candles in the chart, one will be able to determine whether the buyers are in charge of the market or the sellers are in charge.

DESCRIBE A BULLISH AND A BEARISH CANDLE. ALSO, EXPLAIN ITS ANATOMY. (Original screenshot required)

BULLISH CANDLESTICK

Source
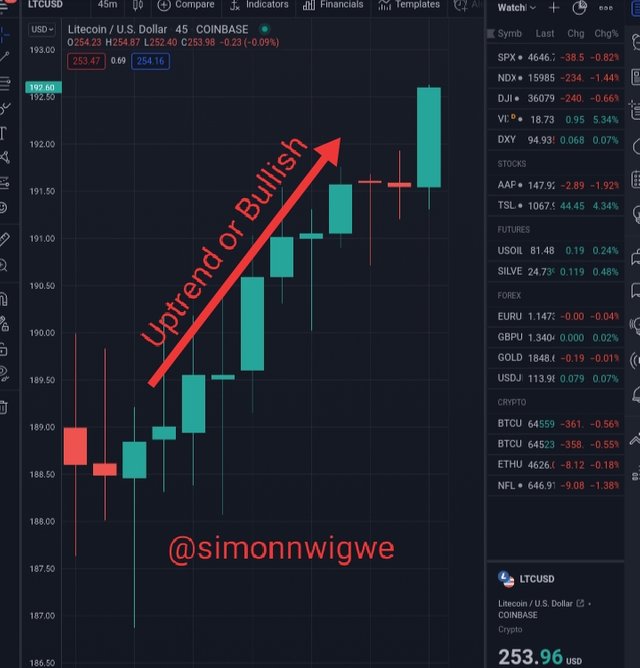
When we talk about the bullishness of a candlestick, we are referring to an increase (positive increase) in the price of an asset I.e the price of the asset is moving in an uptrend direction. Bullish candlestick in terms of colour is usually green as we can see from the screenshot above, and it is also an indication that buyers of the asset are in total control of the market. When an asset is purchase by many people at same time, there is a very strong tendency that the price of the asset will increase and that leads to the bullishness of the asset. In summary, bullish candlestick shows that the market is on a raising side.
BULLISH ANATOMY

Source
When talking about the anatomy of a bullish candlestick, we must consider basic things such open, close, high and low. Let's briefly look at them one after the other.
The open÷ This part of the candle shows the initial price of the asset in a particular period of time. When you look at the lower level of the candlestick you will find this opening there I.e it is usually located at the lower level of the bullish candlestick.
The close÷ This part of the candle shows the finishing price or the highest price of the asset within a period of time. When you look at the higher level of the candlestick you will find this closing there I.e it is usually located at the higher level of the bullish candlestick.
High÷ This shows the topmost asset that was bought in a given period of time.
Low÷ This shows the lowest asset that was bought in a given period of time.
BEARISH CANDLESTICK

Source
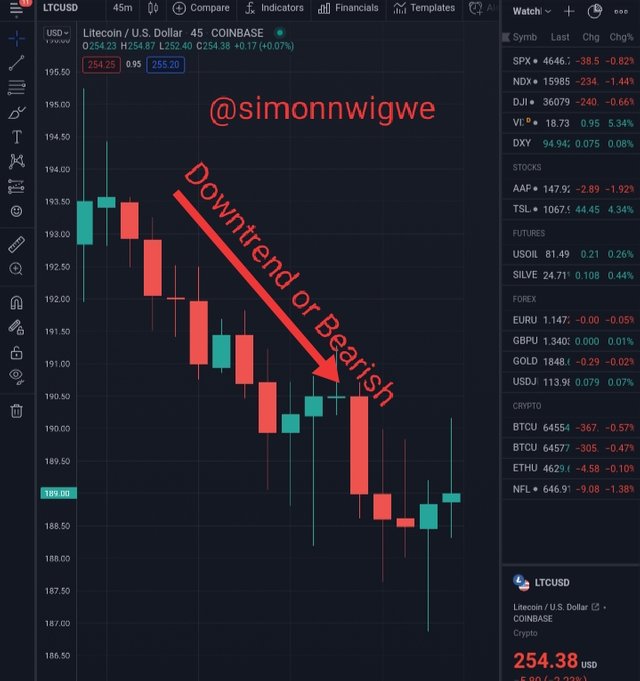
When we talk about the bearishness of a candlestick, we are referring to a decrease (negative movement) in the price of an asset I.e the price of the asset is moving in a downtrend direction. Bearish candlestick in terms of colour is usually red as we can see from the screenshot above, and it is also an indication that sellers of the asset are in total control of the market. When an asset is sold by many people at same time, there is a very strong tendency that the price of the asset will decrease and that leads to the bearishness of the asset. This implies that the price of the asset will drop. In summary, bearish candlestick shows that the market is on a falling side.
BEARISH ANATOMY

Source
When talking about the anatomy of a bearish candlestick, we must consider basic things such open, close, high and low. Let's briefly look at them one after the other.
The open÷ This part of the candle shows the initial price of the asset in a particular period of time. When you look at the higher level of the candlestick you will find this opening there I.e it is usually located at the higher level of the bearish candlestick.
The close÷ This part of the candle shows the finishing price or the lower price of the asset within a period of time. When you look at the lower level of the candlestick you will find this closing there I.e it is usually located at the lower level of the bearish candlestick.
High÷ This shows the topmost asset that was bought in a given period of time.
Low÷ This shows the lowest asset that was bought in a given period of time.

CONCLUSION

Without any ioty of doubt, the Japanese candlestick has proven to be one of the chart pattern that has shown effectiveness and easy to interpret. Hence, I want to sincerely appreciate the professor for such a wonderful lecture. I look forward to learning more from you sir. My little studies and research has broaden my knowledge about the Japanese candlestick.


#club5050 😀
Downvoting a post can decrease pending rewards and make it less visible. Common reasons:
Submit