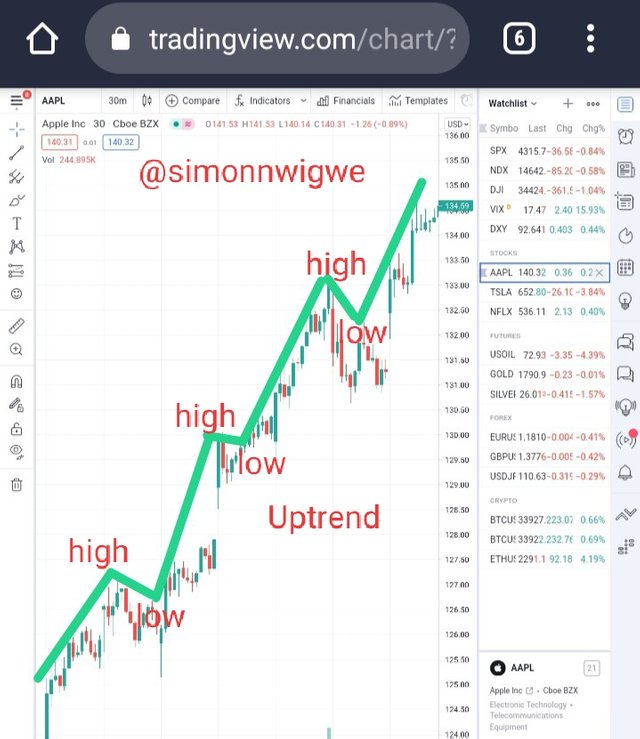
When the price movement in a market structure is stationary or revolves within a certain range of region we say that it is a sideways market structure. Here in this region, we see the resistance and the support range in trades. The movement can be from left to right and right to left as the case may be.
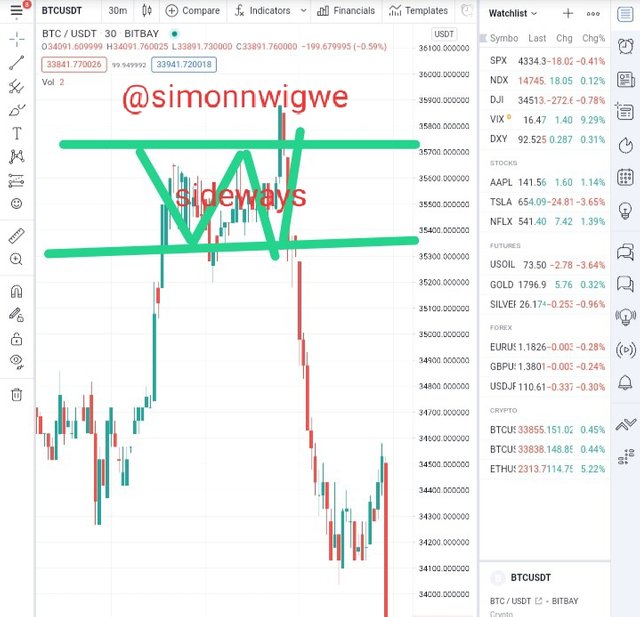
Sideways Market Structure
Question 2
What do you understand about Lower High and Higher Low? Give Chart Examples from Crypto Assets.
To begin, lets recall that the price of an asset can only be classified based on the market structure that they represent. In the case of uptrend, we earlier established that the current high is always higher than the previous hence, it can be concluded that the uptrend is associated with the higher highs and higher lows. Similarly, the downtrend in which price moves in a downward direction, hence it can be concluded that the downtrend is associated with lower highs and lower lows.
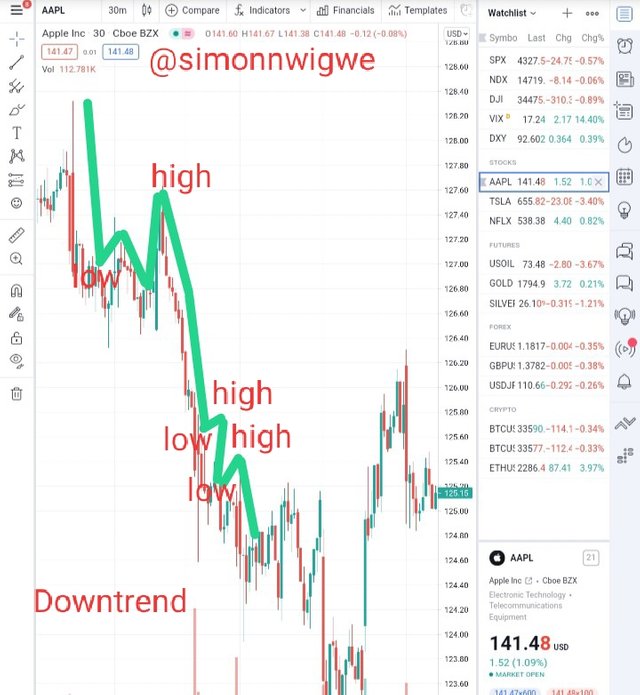
Lower Highs
From my little explanations above, you will notice that the lower highs fall under the categories of downtrend type of market structure which is formed from the swing movement of price. In this place, it creates a current high that is always lower than the previous high. Analysis has shown that when you notice a lower high at the top of an uptrend, it implies that a downtrend is about to set in.
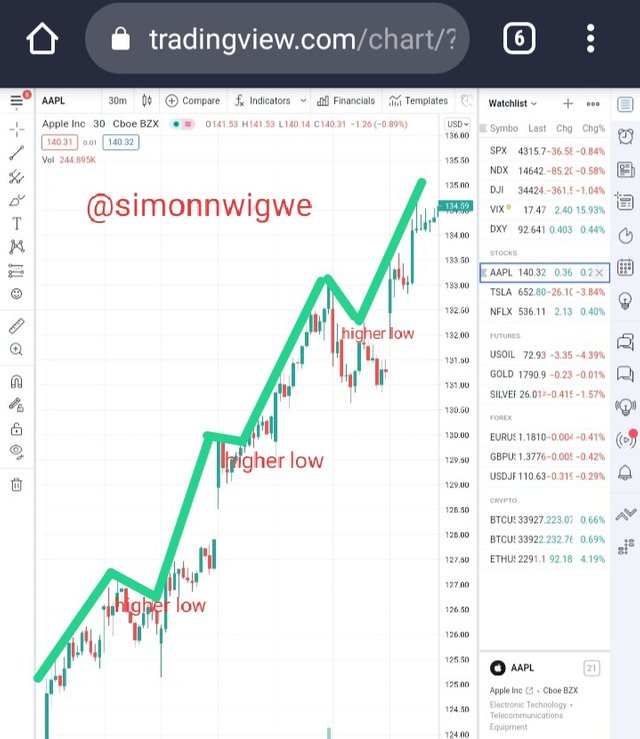
Higher Lows
In the case of higher low, it falls under the category of uptrend type of the market structure. This is formed at the low points of an uptrend. In the higher low, it is notice when an uptrend is observed after some series of downtrend (Lower lows). In summary, I want to say that higher low is what indicates the beginning of an uptrend.
Question 3
How will you identify Trend Reversal early using Market Structure Break? (Screenshots Needed)
Trend Reversal can be seen as the break in market structure which signifies a shift in market sentiment from sellers to buyers or from buyers to sellers as the case may be. To identify early trend reversal, you must have to notice the formation of a lower high and also a lower low at the too of an uptrend. More also, you have to notice the formation of higher low and a higher high at the bottom of a downtrend. In essence, to clearly identify trend reversal early enough you have to take into consideration this factors I have put down.
In view of the question above, I will be using uptrend and downtrend to explain the early reversal. Let's start with the uptrend.
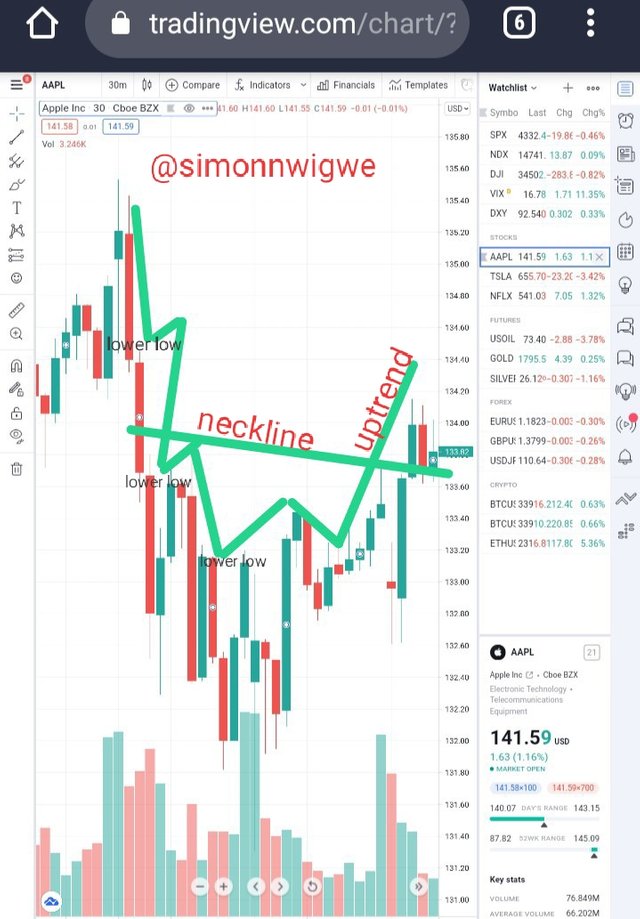
Early Trend Reversal in an Uptrend
To identify early trend reversal in an uptrend, you will have to notice the formation of lower high and lower low at the top of an uptrend as earlier discussed above. When the price moves from higher low to lower low, it is an indication that the trend has changed from uptrend to downtrend.
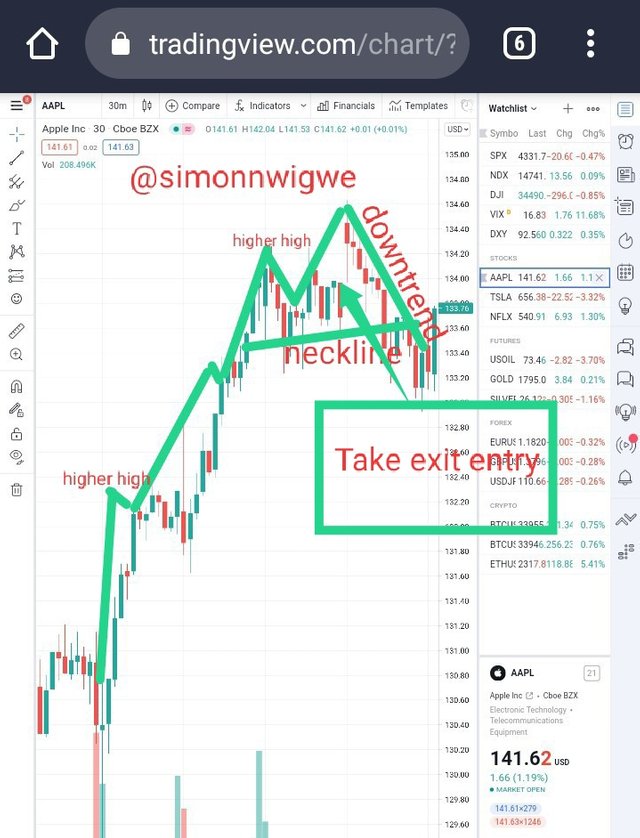
Early Trend Reversal in a downtrend
To identify early trend reversal in a downtrend, you will have to notice the formation of higher low and higher high at the bottom of a downtrend as earlier discussed above. When the price moves from higher low to higher high, it is simply an indication that the trend has changed from downtrend to uptrend.
Question 4
Explain Trade Entry and Exit Criteria on any Crypto Asset using any time frame of your choice (Screenshots Needed)
There are number of set down rules or guide one should follow when ever he or she want to talk about trade entry and exit. This guide are necessary in other to avoid any error in trading or trading the wrong set up. I will be briefly explaining this rules or guide below.
Buy entry criteria
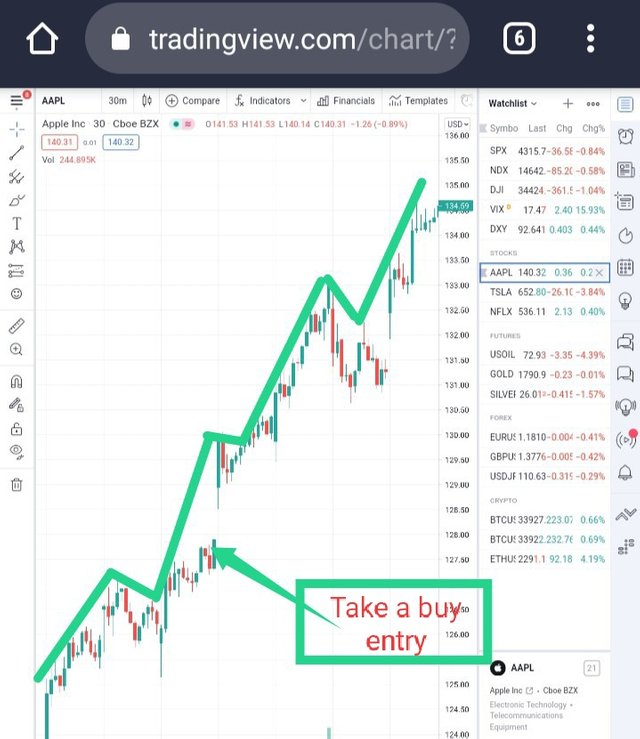
In the buy entry criteria, in the market structure strategy (MSB) the following conditions are needed:
- For buy entry, it is expected that the market should be in a clear downtrend to create lower highs and lower lows.
- More also for buy entry, a clear higher low should also be formed.
- Again, for buy entry, a clear bullish candle which breaks above the previous lower high point should be seen hence breaking resistance. Importantly, the closure of the bullish candle shows the willingness of the price to maintain its movement upward.
- The buy trade is expected to be placed after the bullish candle just right above the previous lower high region.
Sell entry criteria

In the sell entry criteria, in the market structure strategy (MSB) the following conditions are needed:
- For sell entry, it is expected that the market should be in a clear uptrend to create a higher lows and a higher highs
- More also for sell entry, a clear lower high should be formed.
- Again, for sell entry, a clear bullish candle which breaks above the previous higher low point should be seen hence breaking support. Importantly, the closure of the bearish candle shows the willingness of price to maintain its movement downward.
- The sell trade is expected to be placed after the bearish candle just right below the previous higher low region.
Question 5
Place 2 demo trades on crypto assets using Market Structure Break Strategy. You can use a lower timeframe for these demo trades (Screenshots Needed)
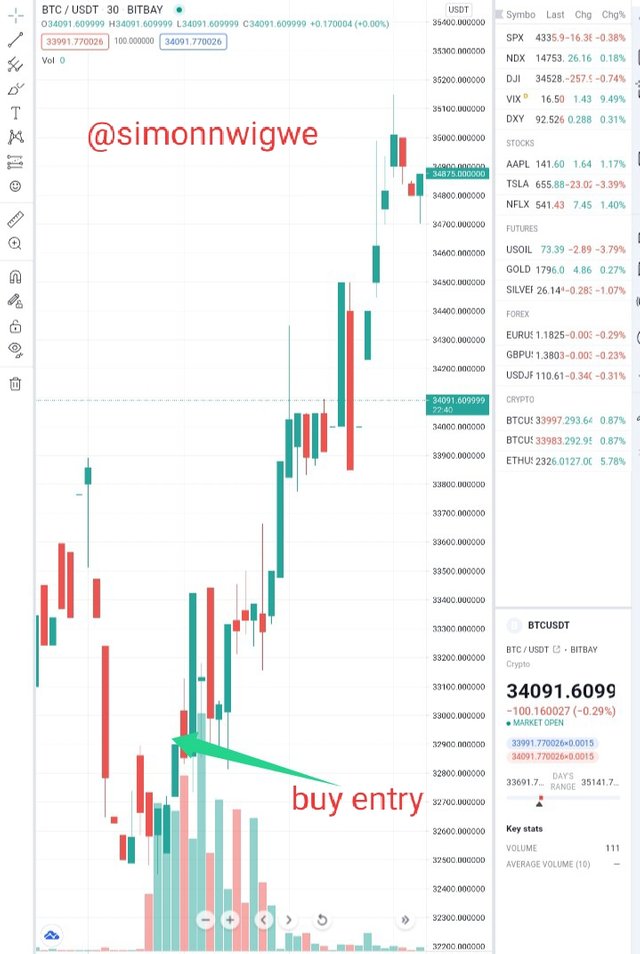
Buy entry
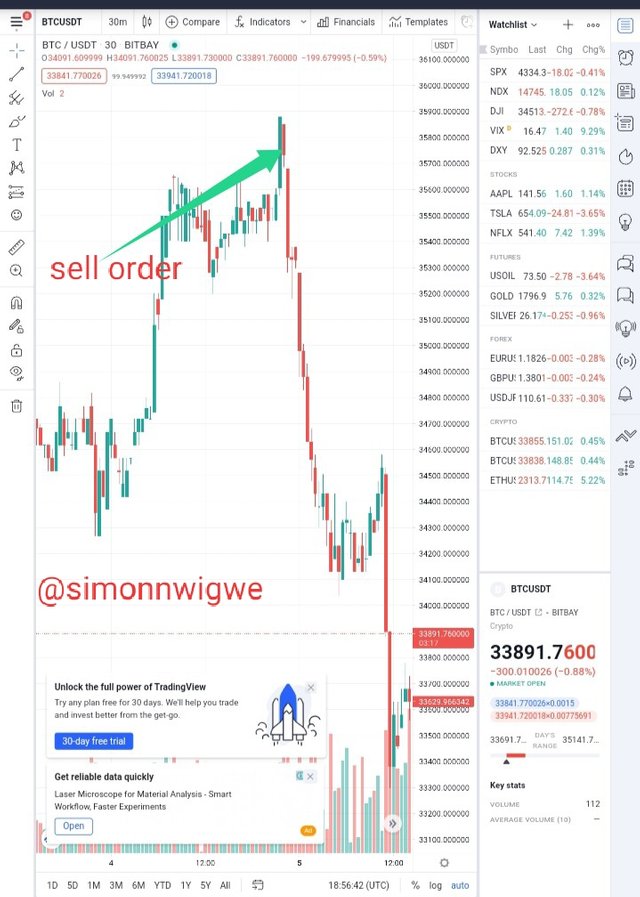
Sell entry
The screenshots below shows a trade demo of buying and selling of BTC and USDT. The sell order as seen in the image is tagged at $35900 and after that the price drops given room for those who wants to buy. On the other hand they buy other from the image above is tagged at $32700 and after that time there is a significant increase in the price.
Conclusion
There is no doubt that once an individual understands the market structure strategies, he or she will do better when analysing any crypto currency. This MSB is the language every trader suppose to understand in other to be successful in the crypto journey.Thank you professor
@cryptokraze for this amazing opportunity to learn from you on this great occasion.

