

Fellow steemians,
It has really been a very educative program since the beginning of the season. The professors have really done their best in no small way. This week I have attended the lecture delivered by professor
@cryptokraze and he talked about sharkfin trading pattern. This blog will be carrying my assignment task.

Question 1: What is your understanding of Sharkfin Patterns. Give Examples
Often when we look at a chart, we sometimes see some sort of movement in the chart. We may see a V-shape or an inverted V-shape movement in a some of this chart, this pattern of the movement is what we call the Sharkfin pattern. In other words, a quick or fast movement of price in a specified direction and the immediate reversal of the movement is what is known as Sharkfin pattern. The reasons why most times this type of movement is experienced when both buyers and seller are not willing to allow the market for either of themselves.
Note also that as a trader, if you closely look at the chart, the areas where you will notice this sharp or quick movement are areas of very strong support or areas of very strong resistance. Now when these areas comes in any chart, there is bound to be a very fast trend reversal either in upward direction or in downward direction as the case may be. For uptrend movement the reversal is seen at the support level whereas for downtrend movement the reversal is seen at the resistance level. Below is a screenshot showing the uptrend movement after a downtrend movement. So from the image you will notice an area of V-shape that indicates the Sharkfin pattern.

Uptrend sharkfin reversal
Similarly, the image below shows the downtrend movement of the market. Take note that for downtrend to occur there must have been a trend reversal in the areas of very strong resistance. So from the image you will notice an area of inverted V-shape that indicates the Sharkfin pattern.

Downtrend sharkfin reversal

Question 2: Implement RSI indicator to spot sharkfin patterns.
To spot Sharkfin pattern using the RSI indicator is very easy. What I will consider here is using the uptrend and downtrend movement of an asset. Overbought or oversold is always seen in areas of the Sharkfin pattern that is the uptrend and the downtrend level respectively. So if to use the RSI indicator we have to take into consideration this two points. Note that by default, the RSI indicator places it's oversold at 30 and the overbought at 70. So using this method we can easily spot the Sharkfin pattern. Let's consider using uptrend and downtrend.
Sharkfin and RSI in Uptrend Reversal
To spot the Sharkfin pattern using the RSI indicator in the uptrend, we said earlier that this occurs in support level so from what we have explained above it means that this should be in areas of oversold which is below 30 RSl level. In this case a V-shaped is formed indicating the Sharkfin pattern. See screenshot below.

Sharkfin and RSI
Sharkfin and RSI in Downtrend Reversal
To spot the Sharkfin pattern using the RSI indicator in the downtrend, we said earlier that this occurs in the resistance level so from what we have explained above it means that this should be in areas of overbought which is above 70 RSl level. In this case an inverted V-shaped is formed indicating the Sharkfin pattern. See screenshot below.

Sharkfin and RSI

Question 3: Write the trade entry and exit criteria to trade sharkfin pattern
Buy Entry Criteria
Introduce the RSI indicator and also allow the default settings do not change it so that you will get a more reliable result.
Price in this scenario should be at the support level and the support level from RSI should be less than 30.
Price reverse immediately it goes below 30 RSI, to show respect to support level.
Bullish signal should be seen indicating presence of buyers
Buy order should be placed when the task number 4 is actualized.

Buy Trade using RSI & Sharkfin
Sell Entry Criteria
Introduce the RSI indicator and also allow the default settings do not change it so that you will get a more reliable result.
Price in this scenario should be at the resistance level and the resistance level from RSI should be above 70.
Price reverse immediately it goes above 70 RSI, to show respect to resistance level.
Bearish signal should be seen indicating presence of sellers
Sell order should be placed when the task number 4 is actualized.

Sell Trade using RSI & Sharkfin
Exit Buy Trade Order
Set your stop loss and take profit level.
Stoploss should be set below rejection level.
Set take profit above the current price.
Risk ratio of 1:1 is the recommended for beginners traders.

Buy Trade exit using RSI & Sharkfin
Exit Sell Trade Order
Set your stop loss and take profit level.
Stoploss should be set above rejection level.
Set take profit below the current price.
Risk ratio of 1:1 is the recommended for beginners traders.

Sell trade exit using RSI & Sharkfin

Question 4: Place at least 2 trades based on sharkfin pattern strategy (Need to actually place trades along with Clear Charts)
Sell Trade using Sharkfin pattern
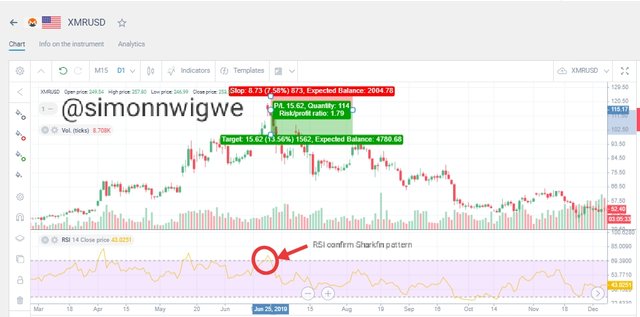
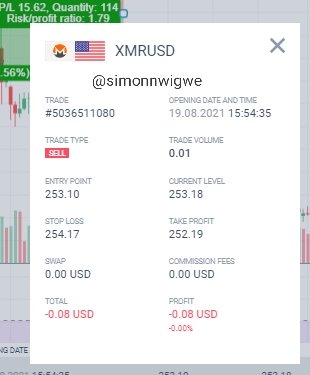
From the image above, I place a sell trade for the pair of coins XMR/USD and I was able to use the Sharkfin pattern to execute the trade. My entry point is set at 253.10, stop loss is set at 254.17 and the take profit was set at 252.19. Below is a screenshot of the order.
Buy Trade using Sharkfin pattern
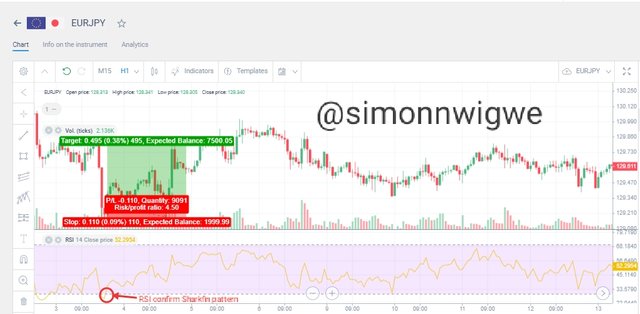
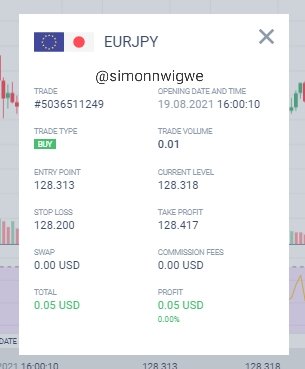
From the image above, I place a buy trade for the pair of coins EUR/JPY and I was able to use the Sharkfin pattern to execute the trade. My entry point is set at 128.313, stop loss is set at 128.200 and the take profit was set at 128.417. Below is a screenshot of the order.

Conclusion
We have always come across the Sharkfin pattern almost on our daily trading lives. Most of us never knew about is but thanks to the professor for such a wonderful lecture it has really exposed me to learning about it. The RSI indicator is an indicator that will help you spot this level without any form of stress. So if you are having doubt or you want to clear read this Sharkfin pattern properly you need to also use the RSI indicator.
Stoploss and take profit are important parameter that most be taken into consideration when ever we want to trade. This will enable you minimize loss and gain more profit. Thank you professor for such an educative lecture.


