Introduction
Hello steemians,
I am so delighted to be a part of these amazing program going on the steemit platform. Since these very program started I have really learnt a whole lot from the various professors. Sincerely this very program has help me to widen my knowledge on blockchain and crypto currency through the lectures delivered by the various professors and my research in carrying out the assignment task. Having attended the lecture delivered by our very own dear professor in the person of @kouba01, on the topic ''Cryptocurrency Trading with Bollinger Bands", I am happy to present my homework task here, this is to prove or indicate my level of understanding concerning the class held by the professor. Please read through as you can learn a bit and also contribute to what I have written so far.
Q1: Define the Bollinger Bands indicator by explaining its calculation method, how does it work? and what is the best Bollinger Band setup?
According to the professor @kouba01, he started that in the year 1980 John Bollinger developed what we today known as the Bollinger band. This Bollinger band is a technical indicator who's main purpose is to measure volatility in price of an asset. Bollinger band is design to determine both overbought and oversold of an asset.
It is important to mention here that the Bollinger band is made up of three major lines which are listed below;
- Upper band
- Simple moving average (SMA)
- Lower band
These lines are plotted in this order. For the first line which happens to be the upper band, it is plotted at plus two standard deviation which can be written as (+ 2SD). This line is seen above the simple moving average (SMA) whereas the lower band is a direct opposite of the upper band line, it is plotted at minus two standard deviation which can be written as (- 2D). In Bollinger band, there are some default settings which are set for trading activities e.g the period is defaultly set at 20. This default setting can actually be altered or change so as to suit the traders interest as regarding the trade in question.
Calculation of Bollinger Bands
To perform any calculation in Bollinger band, one need to put in to consideration these two things; Standard deviation & Moving average. The standard deviation aims at measuring how far the price is from the actual average value of an asset. The closing price of a particular asset over a selected period of time is what is known as Moving Average?
Mathematically, we can represent the formulas as follows.
Moving Average (MA) = Sum of prices over * days/number of days
Upper band = 2SD + MA
Lower band = 2SD – MA
It is important to mention here that users of Bollinger band indicator do not need to calculate or use this calculation at anytime since every trading platform has an inbuilt of this calculations.
How Bollinger Band Works
When discussing overbought, price volatility and oversold, the best indicator to use is the bollinger band. For the sake of this task I will be discussing few of these things that takes place in the bollinger band.
Overbought:
When the price chart touches the upper band, it is an indication that there is an increase in the price of an asset hence this process is termed as overbought. This is a time where traders make a whole lots of profit by selling the coins the hold.
Oversold:
When the price chart touches the lower band, it is an indication that there is a decrease in the price of an asset hence this process is termed as oversold. This is the time where traders buy and hold coins for future use.
Volatility:
When the upper band is far away from the lower band, the market volatility increases but the closer the upper band to the lower band, the lesser the volatility.
How to setup Bollinger Band
To setup a Bollinger band on a price chart, follow the steps below as I have made it simple enough to understand.
First visit the tradingview site, using trading view.com
Click on fx
Search for Bollinger band from the search box and select “Bollinger band”. Once you have done that you will see the chart in this format
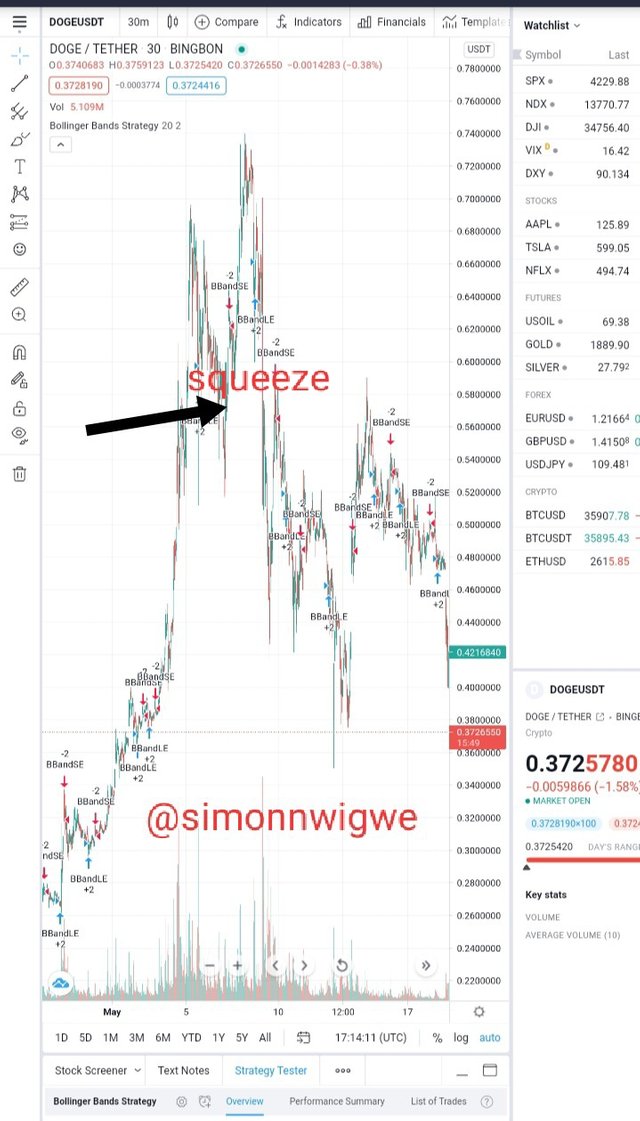
Q2: What is a breakout and how do you determine it? (Screenshot required)
When the asset price moves beyond the support and resistance level, that scenario is termed as breakthrough. Breakout is different in the case of every trader because all traders set jo their support and resistance value.
How to determining Breakout with Bollinger Bands
The key factor responsible to determine the breakthrough is a squeeze. Here the upper and the lower band narrows the moving average hence the price vitality becomes lesser because the upper band and the lower band are not far off from each other. The diagram below shows the squeeze.
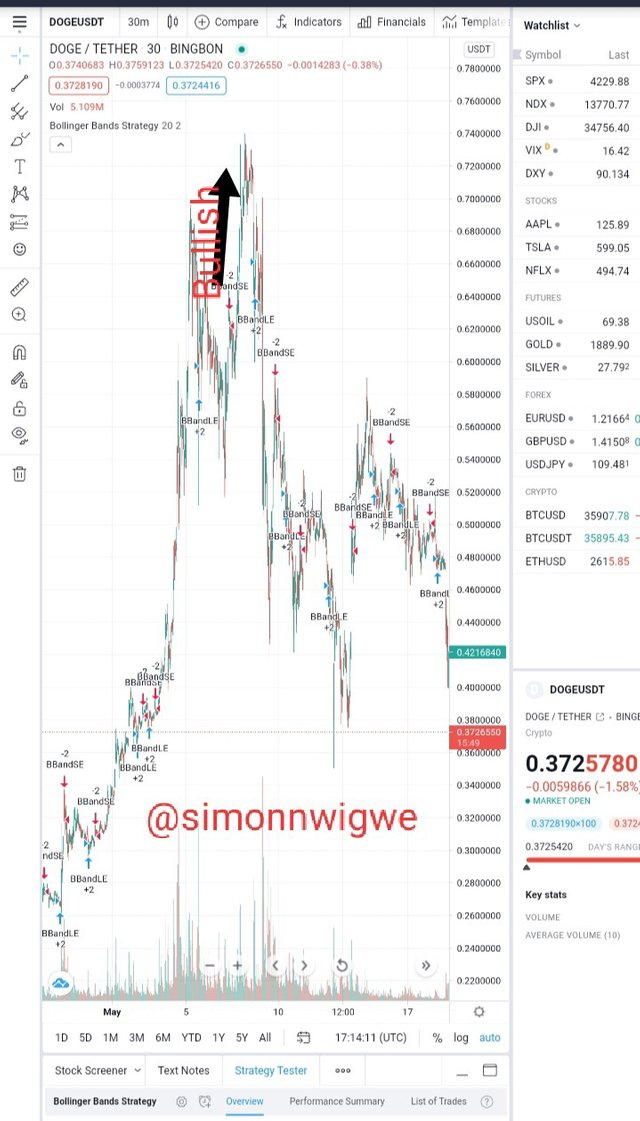
Q3: How to use Bollinger bands with a trending market? (screenshot required)
Bullish Trend
In the case of Bullish trend, as seen in the graph below, the chart moves uptrend and hence it is a point where the traders place them selves a buy position.
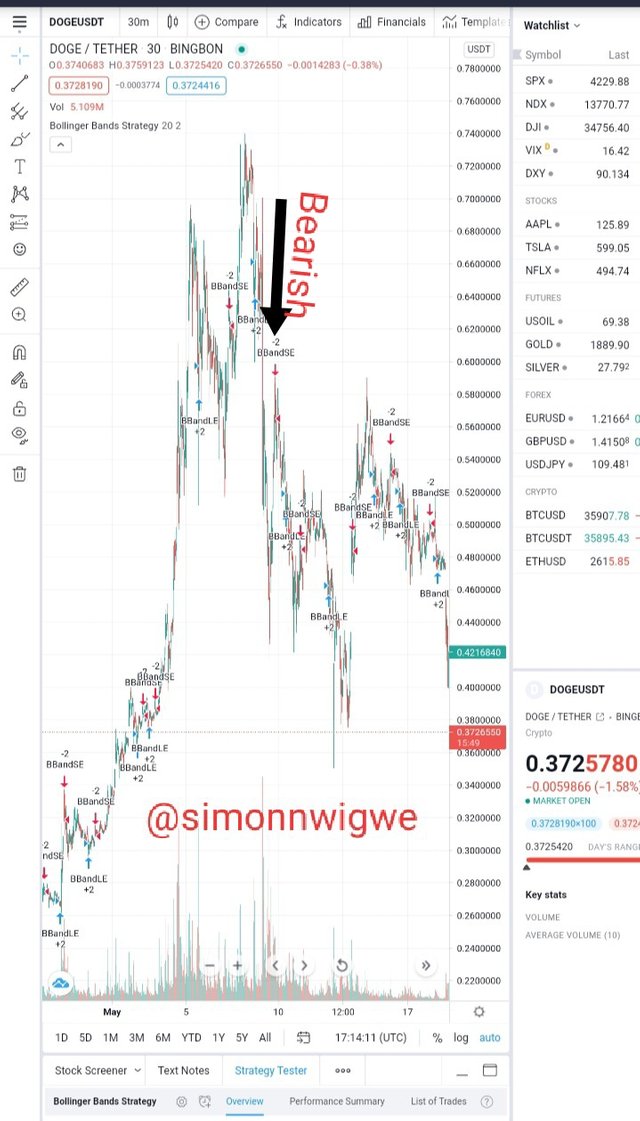
Bearish Trend
In the case of bearish trend, as seen in the graph below, the chart moves downtrend and hence it is a point where the traders place them selves a sell position.
Q4: What is the best indicator to use with Bollinger Bands to make your trade more meaningful? (Screenshot required)
In my view, the best indicator to use along side with Bollinger band is the RSI indicator. When a chart touches the upper band it is considered as an overbought and when a chart touches the lower band it is considered as an oversold. In my view, when these two indicators are used together, it will bring about some certainty in a trader’s analysis. This is so because no one indicator can give us 100% accuracy as a matter of fact, for you to get a better analysis and not to run into loses you need to combine more than one indicator while carrying out any crypto analysis so that you can avoid false signal.
Q5: What timeframe does the Bollinger Bands work best on?And why?
Well the timeframe where bollinger bands works best are numerous for instance when talking about short time trading, it is recommended to use the 10 period moving average in it's analysis. And when ever you use a period below the default value which happens to be 20, the upper and lower band has to be plotted +1.5 and -1.5 respectively. For long time traders like months and years can employ the 50 period moving average in their analysis and have their upper and lower bands plotted at +2.5 and - 2.5 SD respectively.
Q6: Review the chart of any pair and present the various signals giving by the indicator Bollinger Bands. (Screenshot required)
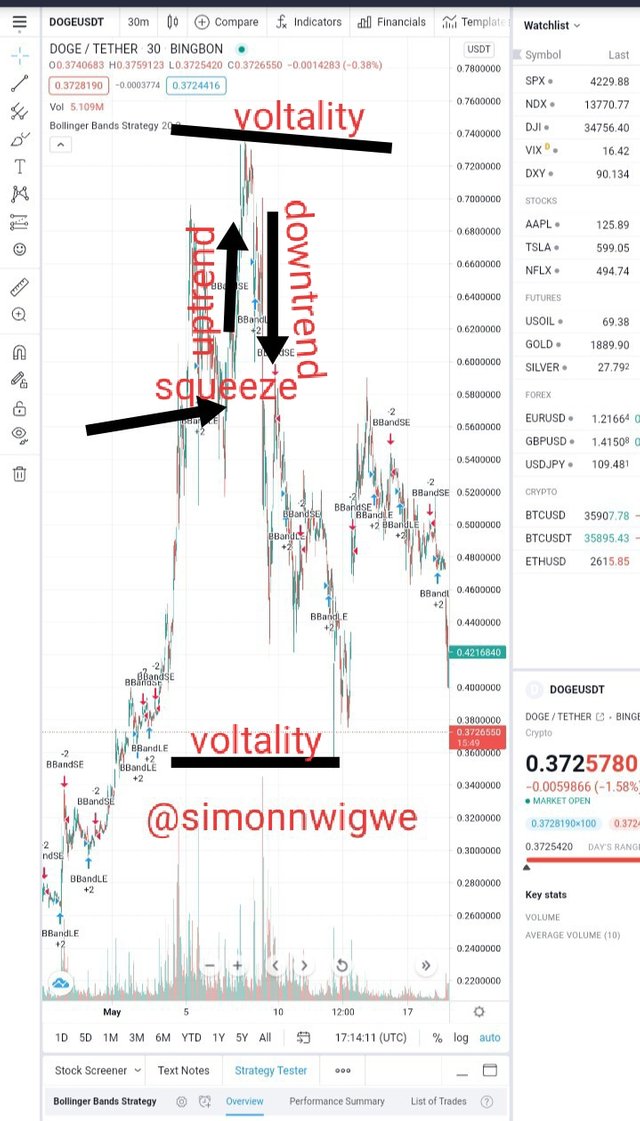
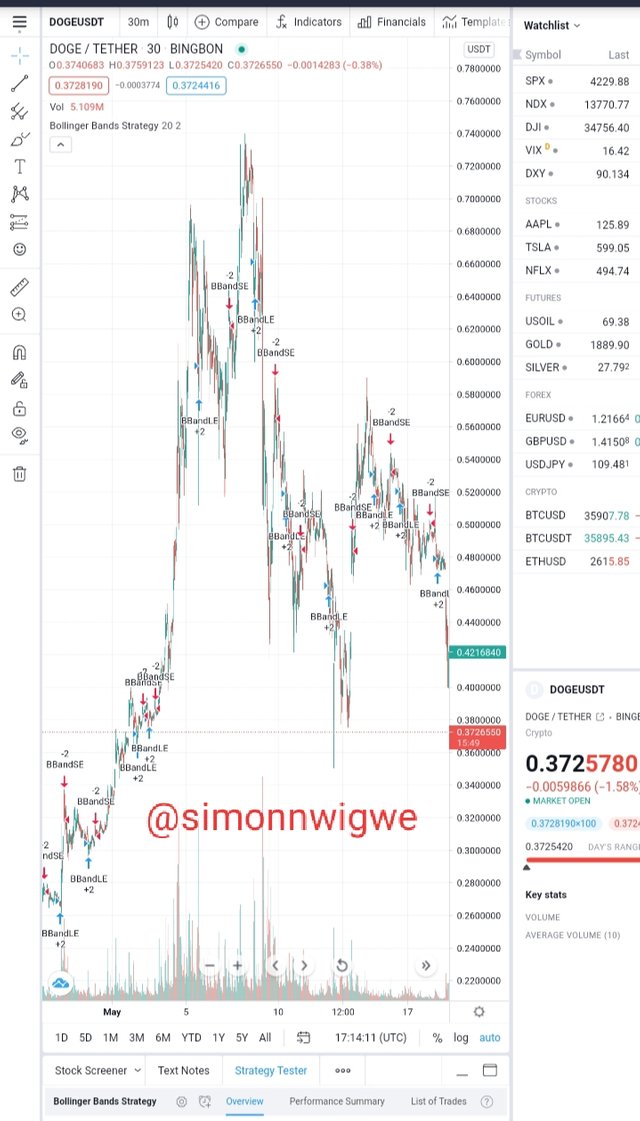
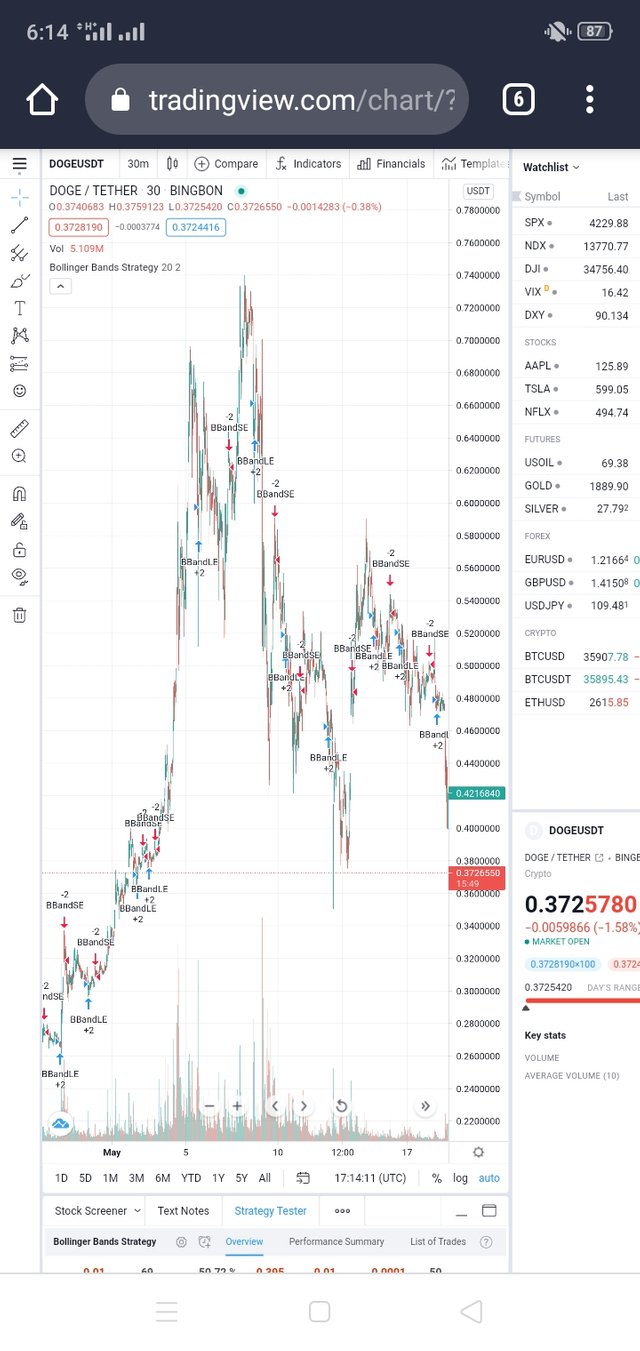
Review of DOGE/USDT chart using Bollinger bands Indicator
Overbought and Oversold
In the chart below you will notice an overbought in the month of may, immediately after the over bought you will notice an oversold.
Price Breakout
Price breakout in bollinger band as earlier discussed is determined by squeeze. Once an asset experience this position it is likely that it will experience an uptrend.
Volatility
As we earlier discussed, when the upper and lower bands are far off from each other it creates a more volatility and when it is closer the volatility minimizes and vice verse.
Other factors include the uptrend, downtrend etc.
Conclusion
In conclusion, I must say I have really learnt a whole lot on this very lecture, I look forward for such an amazing type of lecture once again. My appreciation goes to all the professor for their countless effort.
Hello @simonnwigwe,
Thank you for participating in the 8th Week Crypto Course in its second season and for your efforts to complete the suggested tasks, you deserve a 5/10 rating, according to the following scale:
My review :
Average work, You did not delve into the analysis of the answers, as your role was limited to providing a set of information without explaining it clearly.
Thanks again for your effort, and we look forward to reading your next work.
Sincerely,@kouba01
Downvoting a post can decrease pending rewards and make it less visible. Common reasons:
Submit