

Hi my fellow steemians,
It's a great privilege once again to be part of season number six of the crypto academy. This is already the third week for course lecturing in the academy. This week the professor in the person of
@kouba01 taught extensively on the topic titled
Crypto Trading Using Trix Indicator. Having attended the lecture, I am here to present my response on the homework task given by the noble professor after the lecture. Let's take a ride as we look into the questions one after the other.

1. Discuss in your own words Trix as a trading indicator and how it works

Triple exponential average indicator (Trix) is a momentum based indicator that is made up of a single line which moves between a positive and negative value with zero (0) as it center. The movement of the line is done up and down I.e the up side movement is a movement above the value zero (0) whereas the downside movement is a movement below the value zero (0). We can simply say that the Trix indicator line moves between the positive and the negative numbers with zero as their center.
Triple exponential average indicator (Trix) was developed in the early 1980s by Jack Hutson. This indicator aims to reduce the amount of noise associated with other moving averages that are used in the stock market. The noise we are talking about that is associated to the MA is as a result of fast reaction to price action in the stock market. Seeing the effectiveness of this indicator in the stock market, the indicator was then applied in the crypto market to produce same effectiveness.
As I have earlier explained, Triple exponential average indicator (Trix), has both the negative and the positive side. The negative side is when the values are below zero which is an indication of downtrend or bearish movement in the market. In the same way, the positive side is when the values are above zero which is an indication of uptrend or bullish movement in the market. The points of buy and sell are usually at the point of crossing.
Triple exponential average indicator (Trix), is calculated using the combination of 3 exponential moving averages I.e EMA1, EMA2 and EMA3. EMA's normally react faster to price action and the combination of the 3 EMA's to calculate the Trix indicator helps to smoothen the movement of the indicator by removing every form of noise that may have occur as a result of random movement of the price asset.
How the Trix Indicator Works
Triple exponential average indicator (Trix), works almost the same way as the normal exponential moving average. Though the signal generated by the EMA may contain a lot of noise there by leading to false signal. The Trix indicator on the other hand does not contain much noise as it may have been remove as a result of the 3 EMA's that are combined to form the Trix indicator.
Another work of the Trix indicator is that it is use to identify trend movement, entry position and reversal. We said earlier that there are two phases of the indicator I.e the positive phase which is above the middle line (0) and the negative phase which is below the middle line (0). The positive phase is a phase where buy entry is made whereas the negative phase is a phase where the sell entry is made.
Trix indicator has similarity with the MACD indicator as the both represent their data almost in the same form. The only difference is that the MACD indicator tends to react faster than the Trix indicator. We will discuss this in a more detail as we proceed.

2. Show how one can calculate the value of this indicator by giving a graphically justified example? how to configure it and is it advisable to change its default setting? (Screenshot required)

Every technical analysis got its root from a mathematical expression. The case of the Trix indicator is not a different one. I have stated initial that the calculation is done via calculating 3 EMA's separately and combining it together at the end. Mathematically, this can be represent as follows.
EMA Number 1
EMA1 = EMA(EMA, N, p)
Where
Price = Current Price of the asset
N = period
EMA Number 2
EMA2 = EMA(EMA1, N, p)
EMA Number 3
EMA3 = EMA(EMA2, N, p)
We have successful gotten the expression for EMA Number 1, EMA Number 2 and EMA Number 3, to get the expression for the Trix indicator, we have to combine the formulas together to obtain the expression below.
Trix indicator = [EMA3(p) - EMA3(p - 1)]/EMA3(p - 1)
The mathematical expression of the Trix indicator is what gave raise to the indicator as we can see it on the chart below.
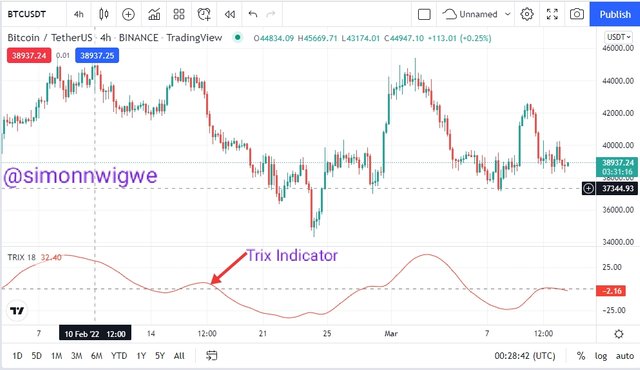
Source
Trix Indicator Configuration
Configuring the Trix indicator is similar to the configuration of every other indicator. The process is the same for all technical indicator. To perform this task, I will be using the trading view.com website. The steps are as follows.
Visit the tradingview official website by clicking on Tradingview
Locate Chart option and click on it
While on the chart page, select a pair of crypto asset of your choice
Click on the indicator menu and search for Trix indicator using the key word Trix and then click on it for it to be added to your chart.
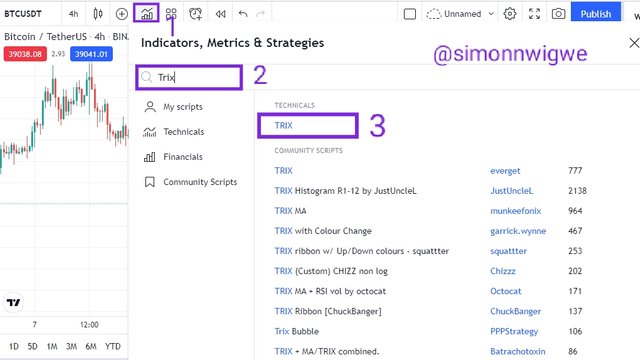
Source
After you have successfully added the indicator to the chart, to modify your settings all you need to do is simply to hover over the name of the indicator and locate settings then click on it. A pop up menu will display as seen in the screenshot below.
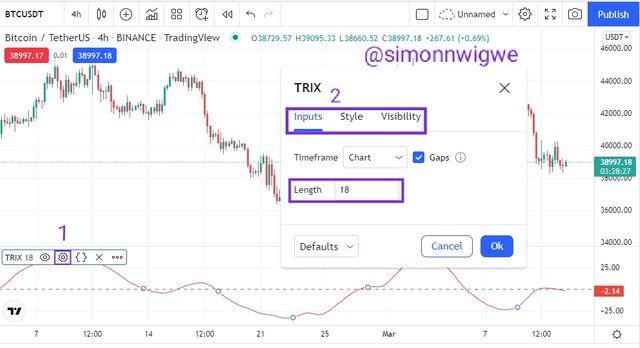
Source
Traders have the option to modify inputs, style and visibility. The input section contains the period of the Trix indicator and by default the period is usually 18. This can actually be changed or modified to suit a traders strategy. Though I don't recommend traders altering this settings unless if you are an experience trader who might have use this indicator before.

3. Based on the use of the Trix indicator, how can one predict whether the trend will be bullish or bearish and determine the buy/sell points in the short term and show its limits in the medium and long term. (screenshot required)

The Trix indicator can be used to predict whether the trend will be in bullish trend or bearish trend by simply looking at the crossing of the Trix line over and below the middle point which is zero. Just like the case of the EMA line which tells the trend direction by the placing of the line below or above the price chart, the Trix indicator identify the trend by the crossing of the middle point which is zero.
Trix line above the middle point zero signifies that the said trend will be bullish in nature and in the same way, the Trix line below the middle point zero signifies that the said trend will be bearish.
Bullish trend are associated to buying opportunities, when the Trix line cross and move above the the middle point, it is a signal to place a buy order. See screenshot below.
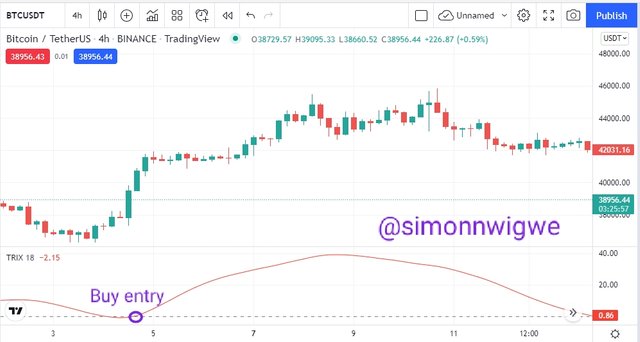
Source
Bearish trend are associated to selling opportunities, when the Trix line cross and move below the the middle point, it is a signal to place a sell order. See screenshot below.
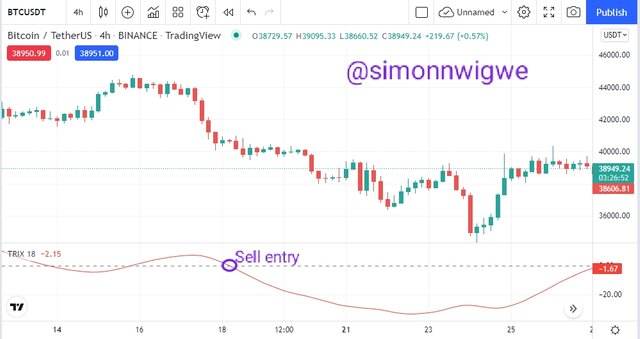
Source
Trix Indicator on short term basis
Seeing the Trix indicator on a short time frame such as period 14 and 15 minutes can really be very unstable and unclear. The reason is that a lot of signal will be generated close to each other. Both buy and sell signal will be seen continuously. Let's consider the screenshot below.
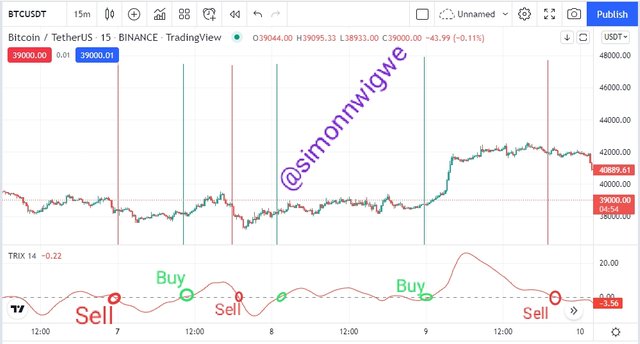
Source
The screenshot above shows a price chart of short time frame with periods 14 and 15 minutes, a lot of buy and sell signal are seen in the chart as well. This type of timeframe is usually use by traders who don't spend lots of time in the market I.e the scalp type of traders. This traders just enter the market and then make use of the trade opportunity provided and then exit the market without any time wasted. Here traders make little profit in the shortest possible time.
Trix Indicator on medium to long term basis
Seeing the Trix indicator on a long time frame such as period 18 and 4 hours, can be a more clear trade such that all the mini entry and exit position will not be taken into consideration only the major entry for both buy and sell will be considered. Let's consider the screenshot below.
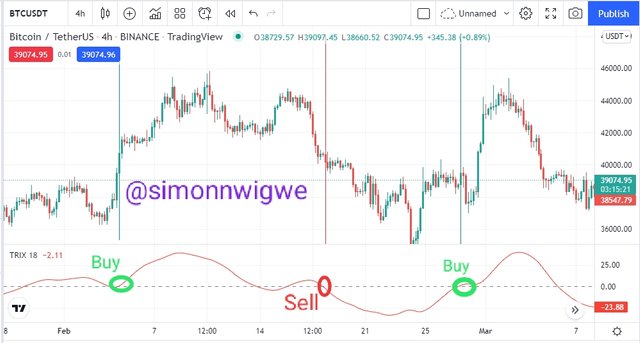
Source
The screenshot above shows a price chart of medium to long time frame with periods 18 and 4 hours, only the major points of buy and sell order are taken into consideration from the chart, all other minor points are discarded. Here traders make a more larger profit but with a lot of time involve. The profit does not come immediately as it may take hours, days, week or even months.

4. By comparing the Trix indicator with the MACD indicator, show the usefulness of pairing it with the EMA indicator by highlighting the different signals of this combination. (screenshot required)

Trix and MACD indicator are really very identical indicator. The both give signal at the crossover of the middle point. The most important difference between them is that the Trix indicator eliminate noise using the smoothen function in the indicator whereas the MACD indicator carries this noise along while moving.
To apply both Trix and MACD indicator on a chart, I will be using the settings of 15 periods for the Trix indicator and an MA with a period of 9 along with it. MACD already has a default setting of (26, 12, 9) and this will be maintain at the course of this analysis. Let's consider the screenshot below where the both indicator are added to the chart.
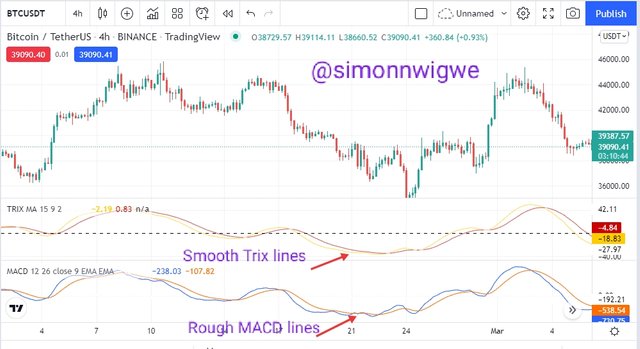
Source
Looking careful on the price chart above, you will see that both indicators have been applied on the chart but a little difference is noticed from the chart I.e the fact that the lines of the Trix is smoother than the lines of the MACD. This smoothness is as a result of the calculation and the removal of noise by the indicator.
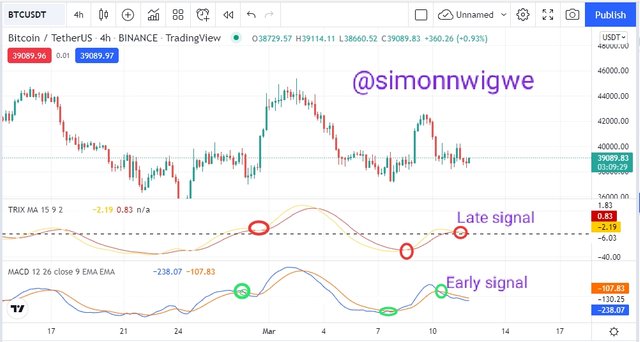
Another important difference that I notice between the Trix indicator and the MACD indicator is the difference when it comes to price reaction. The MACD react fast to price than the Trix indicator. Let's consider the screenshot below for a better explanation.
Source
Looking carefully at the chart, you will notice that price action reacts faster when the MACD indicator is used and later reaction is seen on the Trix indicator. The signal for either buy or sell is usually notice in the MACD indicator before the Trix indicator as we have marked in the chart.

5. Interpret how the combination of zero line cutoff and divergences makes Trix operationally very strong.(screenshot required)

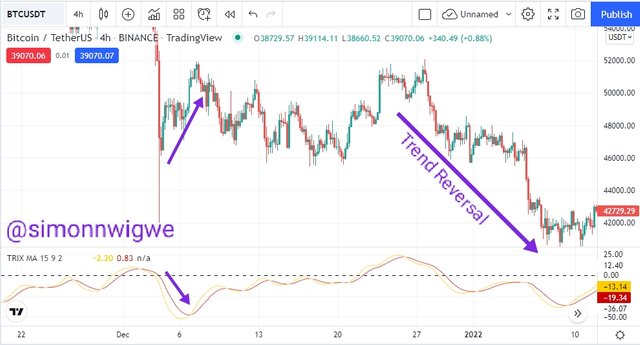
Divergence has to do with price of an asset as well as the indicator moving in different direction or we can say that both price action and indicator are both moving in different or opposite direction. We know that normally, price is suppose to move in same direction as the indicator to be certain of the market trend. But cases where the both move in different direction we call it divergence. The essence of divergence on a price chart is to prepare traders mind on possible trend reversal which is about to take place in the market. Let's see divergence on the screenshot below.
Source
When ever the zero line cutoff is seen, we know that the price is about to move in a specified direction. It is also a sign that the market trend at that point is weak and possible trend reversal to the opposite direction is expected.

6. Is it necessary to pair another indicator for this indicator to work better as a filter and help eliminate false signals? Give an example (indicator) to support your answer. (screenshot required)

No indicator is 100% effective and hence pairing more indicator along side the Trix indicator is a must do or necessary for all traders who wish to minimize loss and maximize profit. Crypto trading analysis should always be done using two or more indicators.
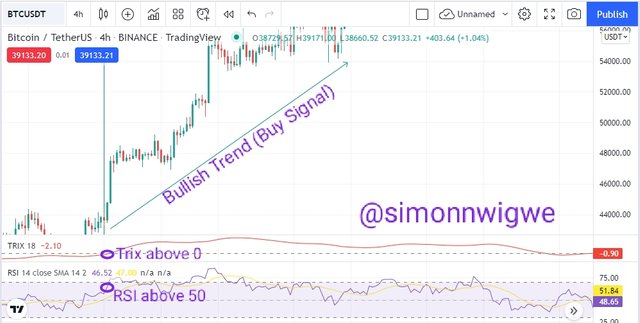
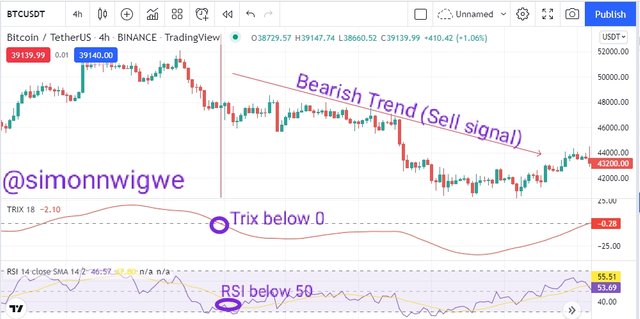
For this task, I will be applying the RSI indicator with the Trix indicator. As we know RSI signals overnight at 70 and above and oversold at 30 and below. Signals for buy are seen the the RSI is above 50 and a sell is seen when the RSI is below 50. For this we want to spot region of buy and sell confirming it with both the Trix indicator and the RSI indicator.
Buy Entry
Source
For buy entry, the Trix indicator must cross above the middle point and the RSI indicator seen above the 50 threshold. The screenshot above shows that all the factors are respected.
Sell Entry
Source
For sell entry, the Trix indicator must cross below the middle point and the RSI indicator seen below the 50 threshold. The screenshot above shows that all the factors are respected.

7. List the pros and cons of the Trix indicator:

There are several advantages and disadvantages of the Trix indicator. I will be listing few of this advantages and disadvantages on the table below.
| Advantages of Trix | Disadvantages of Trix |
|---|
| Entry and exit position are made when ever there is a crossover of the Trix line above or below middle point. | The Trix indicator don't represent the price chart properly when the market is at range it only works perfectly when the market is trending |
| The Trix indicator helps in no small way to reduce the amount of false signal by smoothen the price indicator | Trix indicator cannot be used as stand alone tools, they must be combined with other indicator to obtain a better signal |
| When we see divergence in the indicator we know that price is about to reverse to an opposite direction | Trix indicator is late when it comes to giving signal. As a result of that, the trend may finish before signal will be given to traders. |

8. Conclusion:

Technical analysis has to do with the application of technical indicators on a chart in other to identify an appropriate trend movement. It is important to mention here that no indicator is 100% effective hence for any technical analysis to be correct, at least two or more indicator along side trading strategies mosbe taken into consideration. The Trix indicator as we have seen is use to identify trend and also spot position of entry and exit.
My profound gratitude goes to our dear incumbent professor in the person of professor
@kouba01 for such an insightful and educative lecture. Sir I do hope to continue learning from you.
Best regards
@kouba01
Written by @simonnwigwe


Downvoting a post can decrease pending rewards and make it less visible. Common reasons:
Submit