

Hello guys,
Welcome to week number 5 of the season number 5 in the steemit crypto academy. The academy is indeed moving in progression and a lot of new topics are discussed every week. This week the professor in the person of
@kouba01 discuss extensively on the topic Crypto Trading With Linear Regression Indicator. After reading through the lecture, I am here to attempt the homework task given by the professor. Let's get started as I take you on a ride through my blog.

1. Discuss your understanding of the principle of linear regression and its use as a trading indicator and show how it is calculated?

When we talk about Linear regression we are referring to the relationship between dependant and independent variable which is presented on a chart. A straight line is use to separate this variables on the chart. These variables found in the chart have relationship with one another I.e the dependent variable has relationship with the independent variables.

Source
One of the method adopted by the Linear Regression is the least square method. This method is use to calculate the best fitting points on the graph or chart. So in other to calculate the relationship between the dependent variable and the independent variable, we use the least square method.
In crypto trading, linear regression indicator has to do with with two different things I.e time and price. This means the linear regression in crypto trading takes into consideration the price and time of an asset, one of which acts as a dependable variable and the other as an independent variable. The indicator helps traders to identify their entry and exit points.
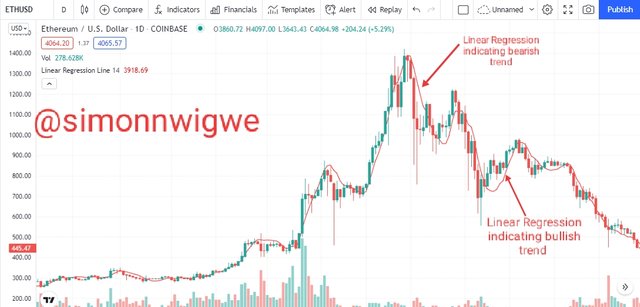
The Linear regression indicator is use to determine the strength of the dependable and the independable variable in our case the price and time. Note also, that the trend movement is also determine via the linear regression indicator. Just like the moving average indicator, the linear regression line if found above the price chart indicates that the trend is bearish but if found below the price chart indicates that the trend is bullish. Let's consider the screenshot below.
Source
From the chart above we can see areas marked for bullish trend and parts marked for bearish trend movement as indicated by the indicator. The linear regression variables are those on the chart such as the opening price, closing price etc. The default length setting for linear regression is a period of 14 days.
Linear Regression Calculation
The formula use to calculate the linear regression can be seen as
Y = a + bX
Where
a = Intercept point
b = Slope of the line
X = The variable
Let's consider a simple example and then apply the formula to see how this is calculated.
If the intercept point of a given equation is 2 and the slope of the line is given to be 0.5 when the variable is 20. Calculate the linear regression.
Solution
From the equation
Y = a + bX
Y =?
a = 2
b = 0.5
X = 20
Substituting the values in the equation will yield
Y = 2 + 0.5 * 20
Y = 2 + 10
Y = 12

2. Show how to add the indicator to the graph, How to configure the linear regression indicator and is it advisable to change its default settings? (Screenshot required)

Adding Linear Regression Indicator to a chart
Just like the same way we add other indicator to a chart, the case of the Linear Regression indicator is not an exemption. Below are few steps to follow when we want to add the indicator to a chart. I will be using tradingview.com site for these explanation. Let's get started.
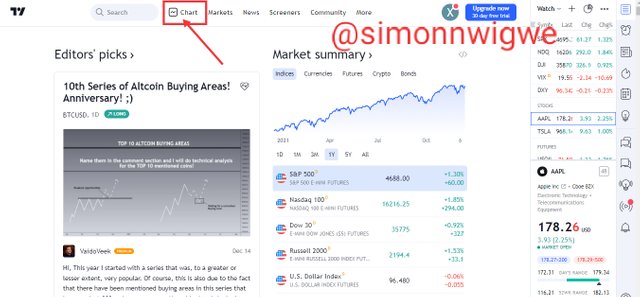
- Visit the tradingview site and then click on chart. See screenshot below
Source
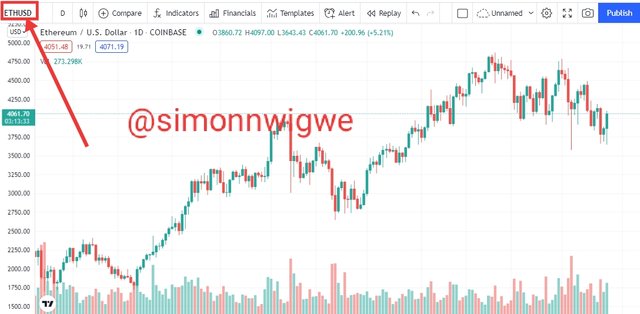
- Select any crypto pair of your choice on the chart
Source
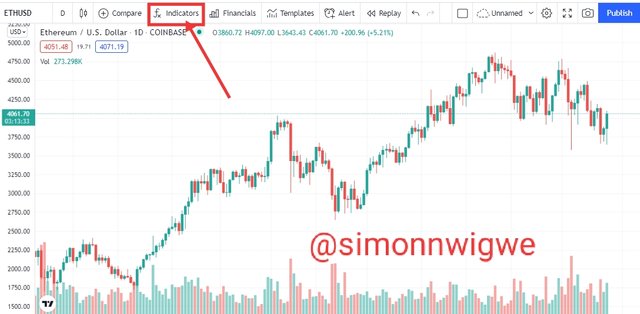
- To add the LRI, click on fx indicator menu as seen in the screenshot below
Source
- On the search bar, type Regression and then select Regression line formula. See screenshot below
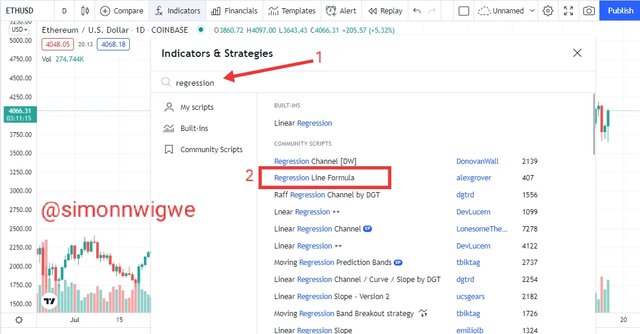
Source
- See how the indicator looks on the chart as I have successfully added it. See screenshot below.
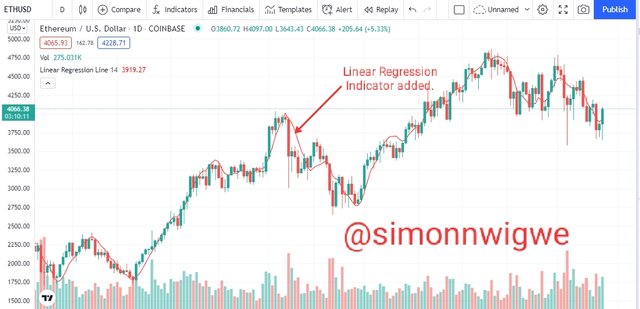
Source
Configuration of Linear Regression Indicator
In other to properly configure the linear regression indicator, the following few steps are to be used.
- Click on the settings icon as seen in the screenshot below
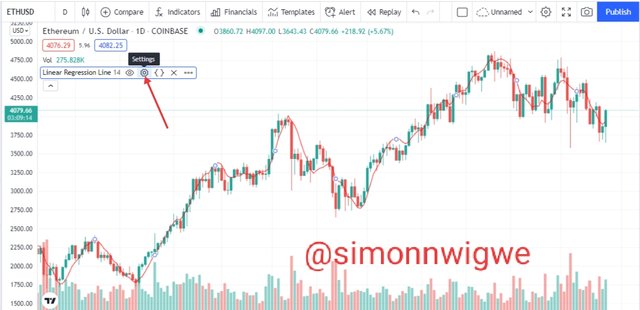
Source
- Immediately after clicking the setting icon, a pop up menu will display with the headings inputs, style and visibility. See screenshot below
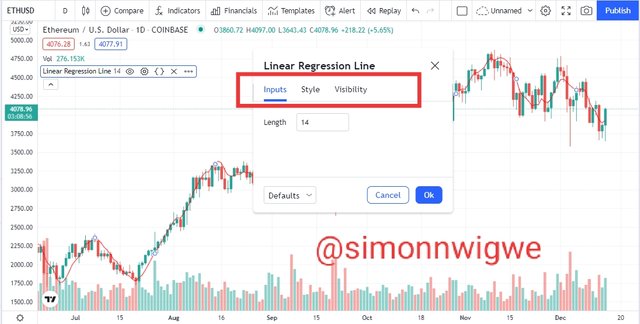
Source
- First heading to consider is the inputs heading. Here we have a default length of 14 already set as the length. This can be change depending on the strategy of the trader.
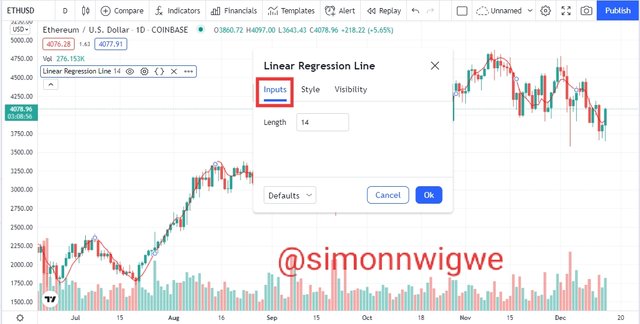
Source
- The next heading is the style, here in this part, we have plot and a box where you can select the colour which the indicator line will be using. See screenshot below.
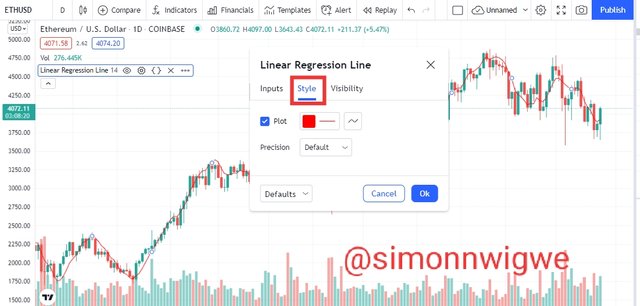
Source
- The last but not the least is the visibility heading here, the default setting is that the indicator be seen in seconds, minutes, hours, days etc you can adjust it to suit your taste. See screenshot below.
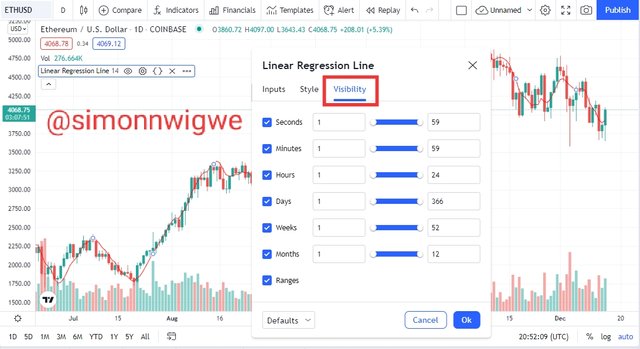
Source
Is it advisable to change its default settings?
In my opinion, the default setting can be change if and only if you have become a very good and advance trader. If you are still a newbies in the crypto currency world and have not been working with indicators, it is advisable you don't change the settings. This default settings as you can see is suitable for every trading strategy. So changing it is not the best unless you have understand trading to the latest.

3. How does this indicator allow us to highlight the direction of a trend and identify any signs of a change in the trend itself? (Screenshot required)

The direction of a trend can be spotted using the linear regression line. The line follows the movement of the price. In the case of bearish movement, the line is normally seen at the top of the price. Here the price will be moving in a downward direction with the linear regression line above the candle stick. See the screenshot below.
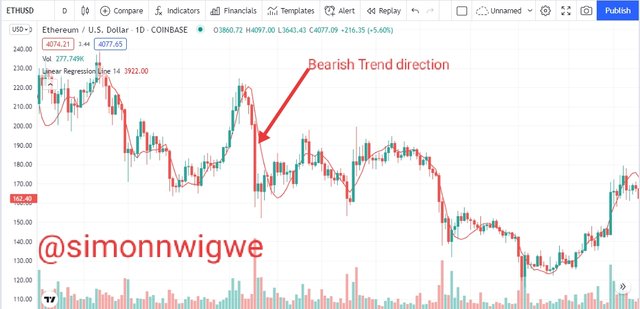
Source
In the case of bullish movement, the line is normally seen at the bottom of the price. Here the price will be moving in an upward direction with the linear regression line below the candle stick. See the screenshot below.
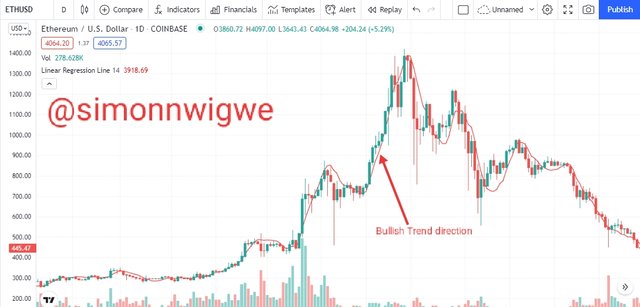
Source
Identification of trend reversal
Trend reversal can simply be seen in any price chart when there is any change in the slope of the price chart. If for instance a price chart moving in a downward direction changes it's movement to upward direction and the linear regression line cross the price chart and fall below the candle stick we then say trend has reversed to a bullish side.
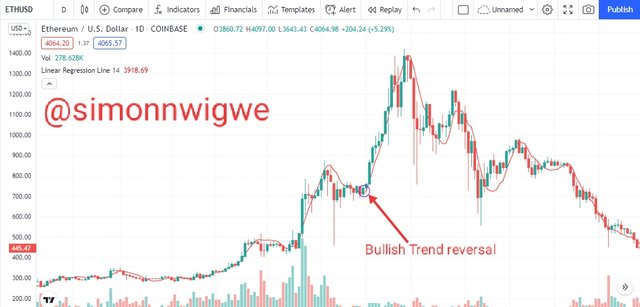
Source
Similarly, If for instance a price chart moving in an upward direction changes it's movement to downward direction and the linear regression line cross the price chart and goes above the candle stick we then say trend has reversed to a bearish side.
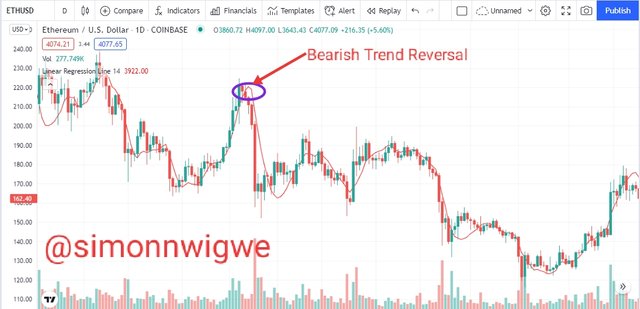
Source

4. Based on the use of price crossing strategy with the indicator, how can one predict whether the trend will be bullish or bearish (screenshot required)

For one to be able to predict whether the trend will be bullish or bearish using the price crossing strategy, one has to understand the points where this crossing takes place. The location of the crossing will go a long way in helping us identify what type of trend will be formed.
In the case of bullish trend, the crossing has to be done when the price is in downtrend that is when the price is moving in downward and the line cut across it then the trend that will be formed is a bullish trend. At that point you will see a breakout and a buy signal is triggered. See the screenshot below.
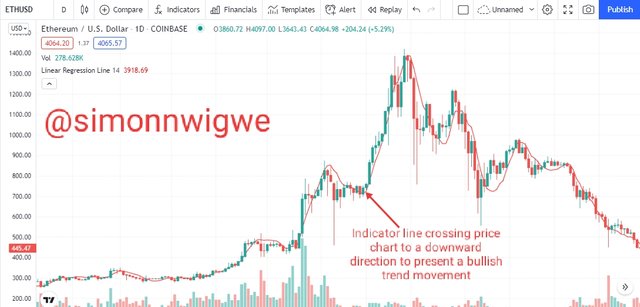
Source
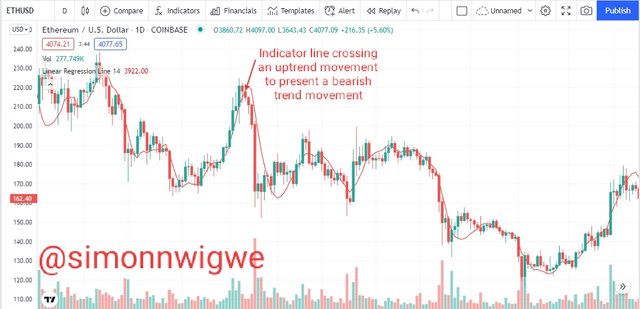
In the case of bearish trend, the crossing has to be done when the price is in an uptrend that is when the price is moving in upward and the line cut across it then the trend that will be formed is a bearish trend. At that point you will see a breakout and a sell signal is triggered. See the screenshot below.
Source

5. Explain how the moving average indicator helps strengthen the signals determined by the linear regression indicator. (screenshot required)

The moving average indicator works similarly with the linear regression indicator. The only difference between them is that the linear regression is fast when it comes to reaction with price action. As I earlier mention this is good but it also have side effect as it may lead to false signal. Now let's see how the moving average can be used to strength the linear regression signal.
Traders who aimed at being very successful in trading always use two or more indicator in a chart this is to help them remove false signal and then trade at almost a very free risk environment. The moving average is used along side the linear regression because it can he'll to spot out all false signal generated by the linear regression. Since the linear regression is fast in reacting to price, the moving average will help track all false signal that the indicator may generate.
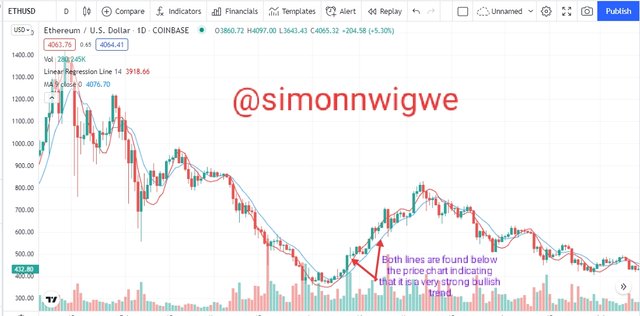
In the case of bullish trend movement, to be certain of the price movement be sure to see that both the linear regression line and the moving average line are seen below the price chart in that way you will be certain that the trend is a genuine trend.
Source
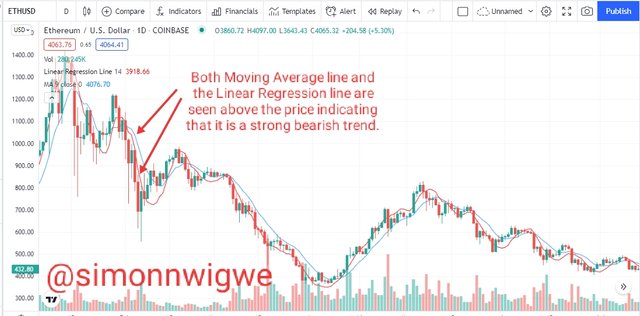
Similarly, In the case of bearish trend movement, to be certain of the price movement be sure to see that both the linear regression line and the moving average line are seen above the price chart in that way you will be certain that the trend is a genuine trend.
Source

6. Do you see the effectiveness of using the linear regression indicator in the style of CFD trading? Show the main differences between this indicator and the TSF indicator (screenshot required)

The effectiveness of the linear regression indicator in CFD trading can not be overemphasied. The reason is that the effectiveness is really very high as the indicator reacts to price movement and trend change. So the issue of spotting a bullish trend or a bearish trend is much easier when dealing with the linear regression.
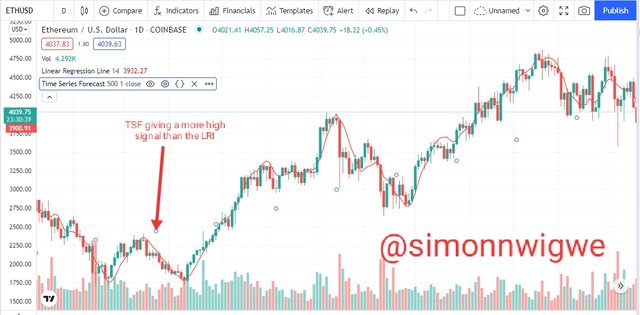
TSF which stands for Time Series Indicator is also a similar kind of indicator like the linear regression indicator. We have established earlier that the linear regression reacts to price faster when compared to other indicator. But when we want to compare the linear regression to TSF, the TSF react even faster to price action. This means that before the linear regression gets the signal the TSF indicator already gives out the signal.
Source
Difference between the Linear regression and TSF
As stated earlier, the TSF indicator react faster to price action. This means that signals generated by the TSF indicator comes much earlier than the once generated by the linear regression. More also, the linear regression indicator are suitable for medium or long term trading whereas the TSF indicator is major use and it is suitable for short time trading.

7. List the advantages and disadvantages of the linear regression indicator:

There are many advantages as well as disadvantages associated with the linear regression indicator. For the sake of this studies, we will be looking at few important advantages and disadvantages of this linear regression indicator in a tabular format.
| S/No. | Advantages | Disadvantages |
|---|
| 01. | The indicator has a characteristic of reacting faster to price action I.e when ever there is a change in direction of price, the indicator spot it faster | When the market is having a high volatility, the indicator is not suitable for such scenario. |
| 02. | The trade signal generated by the indicator is very easy to spot, interpret and understand by everyone. | False signal can be generated using the indicator since it is very fast in spotting price trend. |
| 03. | The indicator can be used to predict the future price and trend | To have a more accurate result when using the indicator, you have to combine it with other form of indicator. |

8. Conclusion:

The Linear regression indicator is indeed a very nice indicator to learn about. The indicator helps traders to spot the trend movement earlier enough. This is good for traders as they will not have to miss any opportunity that may present themselves during trading. The only issue is that there are tendency that this may generate false signals.
Importantly, to avoid the issue of false signal, it is recommended that you use this indicator along side other indicator. This is to spot false signal.
Finally, I want to sincerely appreciate the professor
@kouba01 for such a wonderful lecture. I do hope to continue learning more from you.


Downvoting a post can decrease pending rewards and make it less visible. Common reasons:
Submit
Nice article you explained with detail
I want to ask something
Someone suggest me
BNB Energy tokens
Should I invest in this token
Moslty new tokens are scam
Downvoting a post can decrease pending rewards and make it less visible. Common reasons:
Submit