1. Show your understanding of the SuperTrend as a trading indicator and how it is calculated?
One of the most popular and widely use indicator by most traders is the supertrend indicator. This is because the indicator is easy to use and understand. The indicator is mainly use to track the trend direction of the asset and it uses two different colours (red and green) to show which trend the market is currently on.
The indicator was developed by Olivian Sebian. Here the developer made use of the Average true range when calculating it's value with respect to price volatility.
In a bullish trend, the indicator changes colour by default to green and then is seen at the bottom of the price chart. Here, the indicator which is seen below the price chart act as support as the price continues moving in an upward direction.
In a bearish trend, the indicator changes colour by default to red and then is seen at the top of the price chart. Here, the indicator which is seen above the price chart act as resistance as the price continues moving in a downward direction.
In a range trend, the indicator is seen moving horizontally above or below the price chart. If it is seen above the colour will be red and if it is found below the colour will be green.
To calculate the Supertrend indicator, we ought to use the relationship below.
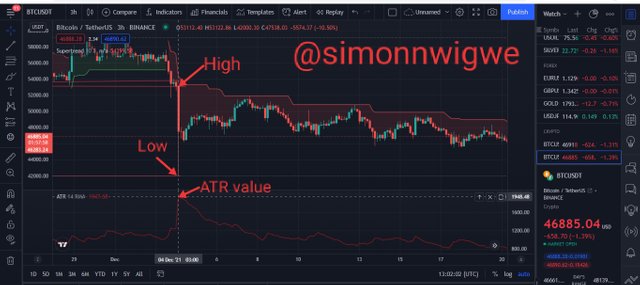
From the screenshot above, I applied both the Supertrend indicator and the ATR indicator. The selected candle is to be calculated using the supertrend upper line formula. The details contain from the selected candle are as follows
This is almost close to the point marked on the chart as we have the point at 53,517.85
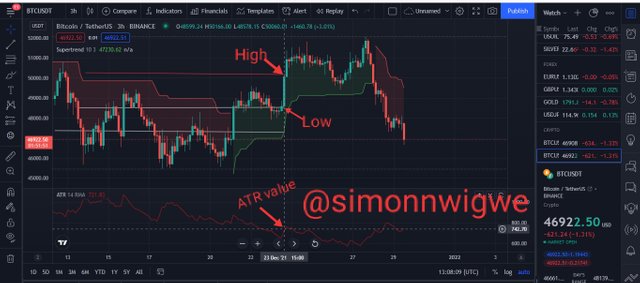
From the screenshot above, I applied both the Supertrend indicator and the ATR indicator. The selected candle is to be calculated using the supertrend lower line formula. The details contain from the selected candle are as follows
This is same as the exact point marked on the chart.
2. What are the main parameters of the Supertrend indicator and How to configure them and is it advisable to change its default settings? (Screenshot required)
Basically, the main parameters of the supertrend indicator are Average true range and the Multiplier. This implies that this are the two main parameters of the supertrend indicator.
Average True Range: The average true range is gotten from the calculation of true range over a period of time. In other words, to get the average true range value, we need to calculate the true range and then take the average of the answer gotten to have our average true range. To calculate the true range we can use the relations below
- Current high - Current low
- Current high - Previous close
- Current low - Previous close
From the formulas listed above, when the calculations are done using them, the one whose value is higher becomes the True Range.
If for instance, we are to consider a trading period of 14 days, the trading periods will be calculated using the relations (formula) listed above and then the average of the values will be calculated using the relation below
Current ATR = ((Prior ATR *13) + Current TR)/14
Multiplier(Factor): The multiplier (factor) is a number which is used to multiple the average true range value during the calculation of a supertrend indicator. When we are calculating the supertrend upper line, we add the value gotten from the multiplication of the multiplier and the ATR to the value of the mean of high and low. In the same way, when we are calculating the supertrend lower line, we subtract the value gotten from the multiplication of the multiplier and the ATR from the value of the mean of high and low.
How to configure them and is it advisable to change its default settings? (Screenshot required)
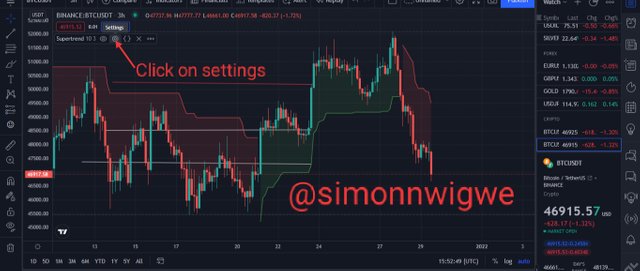
To configure the indicator, you click on settings option as seen from the screenshot below.
Source
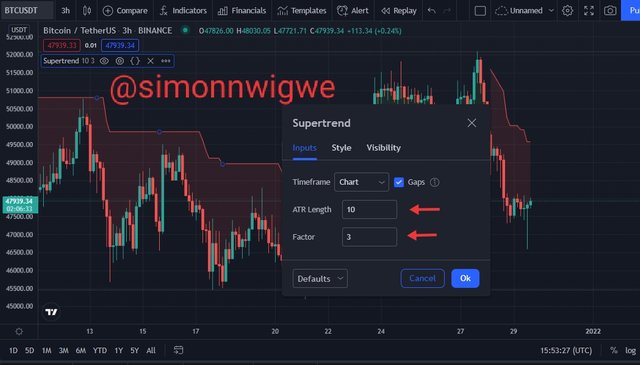
A pop up menu will display as we can see from the screenshot below.
Source
We are going to focus more on the inputs part as it is the part that carries the two main parameters we mentioned earlier. From the screenshot above, you can see that by default the ATR value is set to 10 and the Multiplier (factor) is set to 3.
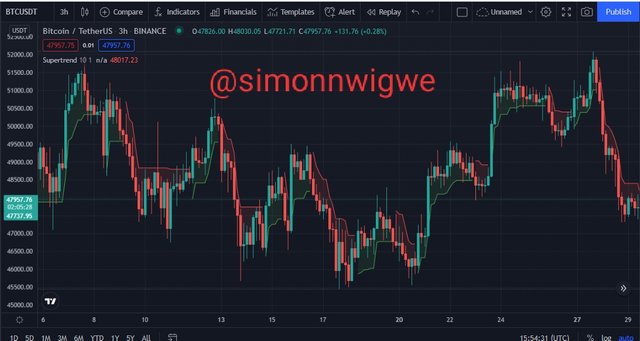
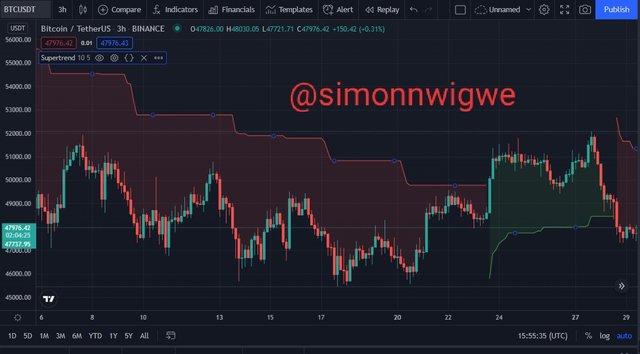
Now, lets alter this default settings and the see how the indicator will look like of the chart. I will want to change the value of the multiplier to a more less number say 1. Let's consider the chart below.
Source
From the screenshot above, you will notice buy and sell signal more frequent than the usual. Here there is much reaction to price volatility and that has lead to seeing much buy and sell signal often. So from these settings, we can see that there are lots of false signal in the market and hence it is not recommended.
Source
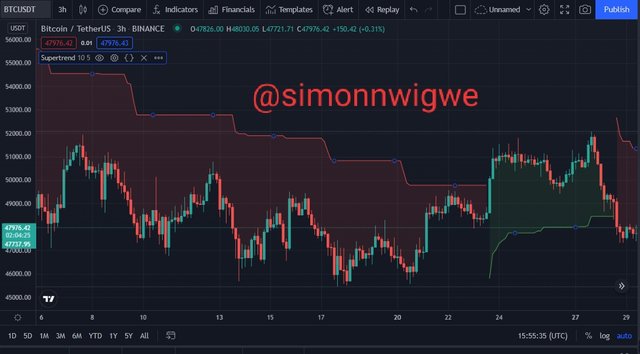
From the screenshot above, I still made a little change on the multiplier (factor), I increased the value to 5 and from my observation, you can see that the buy and sell signal are far from each other and with this a lot of false signal are seen in this wide range movement. This is also not recommended.
From the case scenario we have seen above, we can therefore conclude that it's not advisable to change the default settings most especially when you are new to trading and using of this indicator. The default setting has been tested and confirm to give an average result which is very good. I recommend the default settings be used.

3. Based on the use of the SuperTend indicator, how can one predict whether the trend will be bullish or bearish (screenshot required)

To predict whether the next trend would be bullish or bearish using the supertrend indicator is quite not too difficult. First and foremost you ought to know the current trend of the market and in that way you will be able to predict the next trend. From my little observation, I notice that when a particular trend is about to reverse, it then starts forming a horizontal straight line at its end and if that is seen in the bullish trend, it implies that the next trend will be bearish.
Bullish Trend: As we know already in a bullish trend, the indicator is found below the price chart and it's always green in colour and acts as a dynamic support level. As I have explained above if the trend is going to reverse to bearish direction, you will notice a horizontal straight line forming at the bullish end of the indicator.
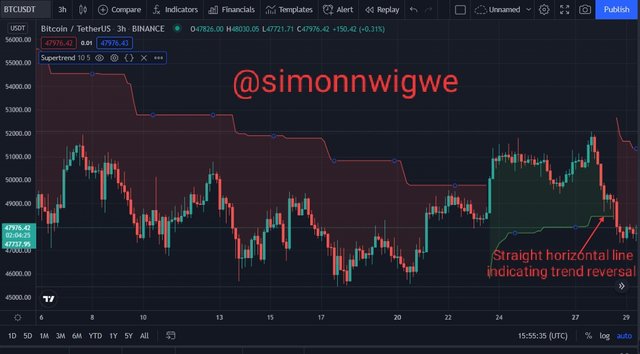
Source
From the screenshot above you can see that the price is above the indicator while the indicator acts as dynamic support. You can also see a horizontal straight line forming at the bullish end of the indicator which implies that the next trend will be bearish.
Bearish Trend: As we know already in a bearish trend, the indicator is found above the price chart and it's always red in colour and acts as a dynamic resistance level. As I have explained above if the trend is going to reverse to bullish direction, you will notice a horizontal straight line forming at the bearish end of the indicator.
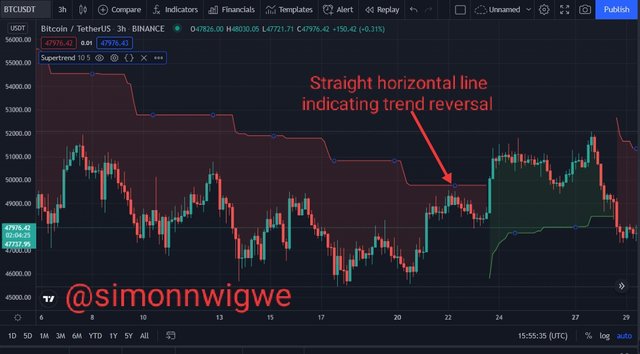
Source
From the screenshot above you can see that the price is below the indicator while the indicator acts as dynamic resistance. You can also see a horizontal straight line forming at the bearish end of the indicator which implies that the next trend will be bullish.

4. Explain how the Supertrend indicator is also used to understand sell / buy signals, by analyzing its different movements.(screenshot required)

Buy and sell signal are easier understood using the supertrend indicator because when you are ready to buy an asset, you have to wait for the trend to reverse from downward movement to upward movement. The indicator helps to identify this points where we can place a buy or sell position.
For buy signal, you must be sure to see the price moving in an upward direction with the supertrend indicator below the price chart. If you notice the supertrend below the price chart with green colour you can place your buy entry.
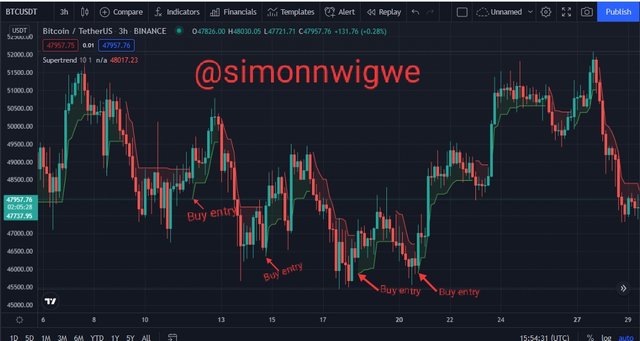
Source
From the screenshot above, the points marked are all buy entry position which has been indicated by the supertrend indicator.
For sell signal, you must be sure to see the price moving in a downward direction with the supertrend indicator above the price chart. If you notice the supertrend anove the price chart with red colour you can place your sell entry.
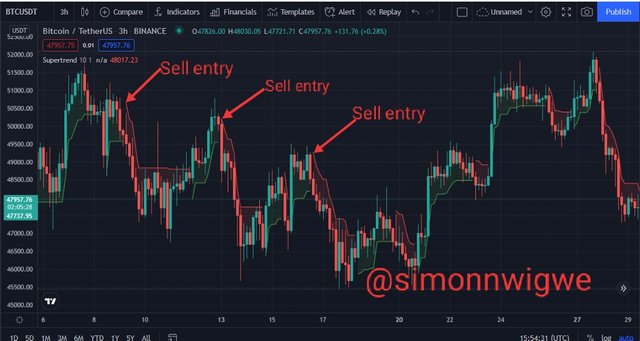
Source
From the screenshot above, the points marked are all sell entry position which has been indicated by the supertrend indicator.

5. How can we determine breakout points using Supertrend and Donchian Channel indicators? Explain this based on a clear examples. (Screenshot required)

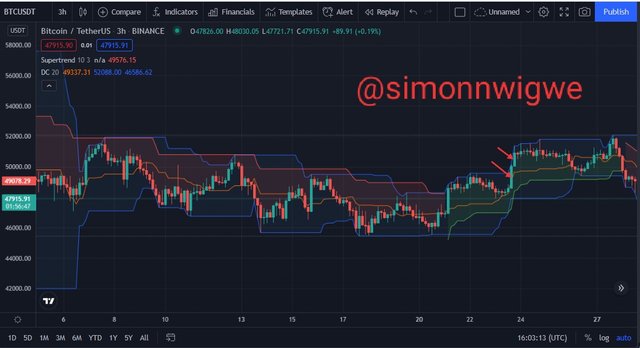
Bullish Breakout: In the case of bullish breakout using the Supertrend and Donchian Channel indicators, the price movement must be in an upward direction and the supertrend indicator below the price acting as a dynamic support. You will have to observe carefully and then notice two bullish candles breaking the upper limit of the Donchain Channel. When this is seen, it is a confirmation that there will be bullish breakout.
Source
The two bullish candle are marked above as we can see from the the screenshot.
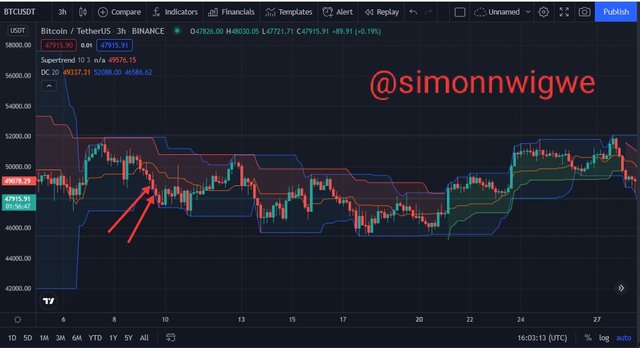
Bearish Breakout: In the case of bearish breakout using the Supertrend and Donchian Channel indicators, the price movement must be in a downward direction and the supertrend indicator above the price acting as a dynamic resistance. You will have to observe carefully and then notice two bearish candles breaking the lower limit of the Donchain Channel. When this is seen, it is a confirmation that there will be bearish breakout.
Source
The two bearish candle are marked above as we can see from the the screenshot.

6. Do you see the effectiveness of combining two SuperTrend indicators (fast and slow) in crypto trading? Explain this based on a clear example. (Screenshot required)

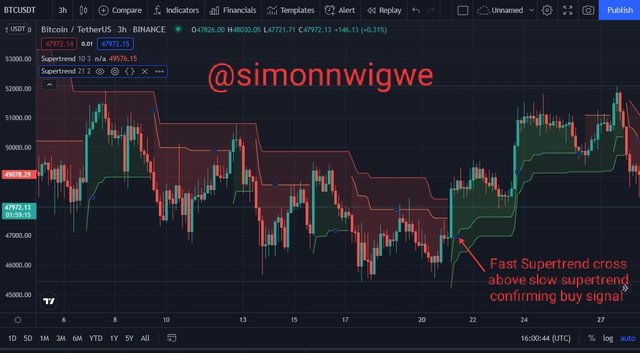
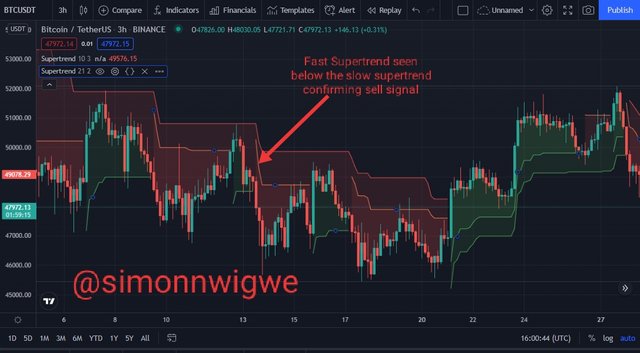
When two SuperTrend indicators (fast and slow) are combined in a crypto trade, it is more effective as it will help to confirm the signal generated. In this task, I want to use the the slow supertrend indicator with the ATR 10 and multiplier 3, then combine it with a fast supertrend indicator with the ATR 21 and multiplier 2.
Buy Signal: For buy signal, it is confirm when the fast supertrend indicator crosses the slow one from below upward and then both of the indicators are green in colour. Also, the both of them then selves as dynamic support to the price. The position will be exited when the fast supertrend indicator turns red.
Source
Sell Signal: For sell signal, it is confirm when the fast supertrend indicator crosses the slow one from above downward and then both of the indicators are red in colour. Also, the both of them then selves as dynamic resistance to the price. The position will be exited when the fast supertrend indicator turns green.
Source

7. Is there a need to pair another indicator to make this indicator work better as a filter and help get rid of false signals? Use a graphic to support your answer. (screenshot required)

As a good trader, it is never recommended to use only one indicator in your trade no matter how effective that indicator is. We know that no indicator is 100% effective and in so doing they are prone to generating false signal. For any indicator to function properly, it is recommended that it is been combined with other indicators.
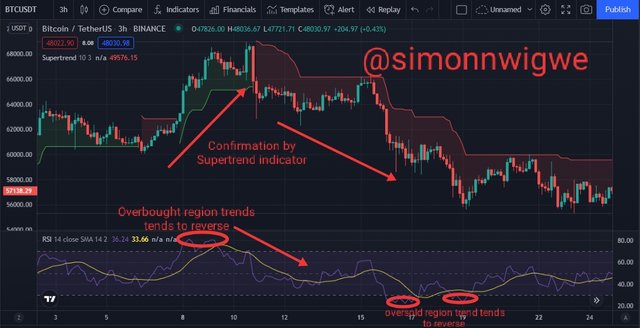
Here in this question, I want to combine the supertrend indicator along side Relative Strength Index (RSI) indicator. As we know earlier that the RSI indicator is mainly use to spot overbought and oversold position in the market and the possible reversal in the trend of the market after this position.
Once the RSI is seen at 70 and above it implies that the asset is in an overbought region and a possible trend reversal is expected, in the same way, when the RSI is seen at 30 and below it implies that the asset is in an oversold region and a possible trend reversal is expects.
Source
From the screenshot above, we have been able to use the RSI to confirm the trend movement in the price of the asset as indicated by the supertrend indicator. If there is any fake out in price it will be indicated by one of the indicators which will help traders not to enter the market at that point in other not to incur losses.

8. List the advantages and disadvantages of the Supertrend indicator:

The table below are the list of few advantages and disadvantages of the Supertrend indicator.
| Advantages | Disadvantages |
|---|
| One of the advantages of Supertrend indicator is that it is mostly use to indicate the direction of the market trend. | The indicator is more of lagging than leading and because of that, the indicator tends to give some signal later and traders may have miss out some important moves which could have profited them. |
| The Supertrend indicator is very easy to read and interpret hence even newbies in the crypto world can use it | Supertrend indicators are mostly used in trending market I.e if the market is in a range, traders who use these indicator to trade may loose a lot of their asset. This means that it is not good to use when the market is in a range |
| Trading using the Supertrend indicator can be done using anytime frame | Small periods used in trading via the Supertrend indicator can generate false signal. |

9. Conclusion:

Supertrend indicator as we have seen is a very important technical analysis tool used by many traders to minimize loss and maximize their profit. The indicator helps traders to make a better trading decision since it helps in both detection and confirmation of trend in a very simple and easy way.
We know that as a trader, it is not advisable to always rely on just one indicator to make decision because no indicator is 100% efficient. It is also recommended that in the case of the supertrend indicator, traders should always combine it with other technical indicator in other to filter false signal and make a better trading decision.
I want to sincerely appreciate the professor in the person of
@kouba01 for such an educative and insightful lecture. This season of the academy has really been fun and lots of learning with your presence. I do hope to see you again come next season.




Downvoting a post can decrease pending rewards and make it less visible. Common reasons:
Submit