Greetings my fellow traders,
It's the first week of the Steemit Learning Challenge for season 21 and I'm delighted to join this week's competition which is titled Mastering Steem Market Volatility Using Bollinger Bands. I will be attempting the questions given below as part of my entry for the contest.
| Question 1: Explain the Components of Bollinger Bands |
|---|
Describe the three main components of Bollinger Bands: the simple moving average (SMA), the upper band, and the lower band. How does each component contribute to understanding market volatility and making trading decisions?
Before we go ahead to explain the various components of Bollinger Bands, it is important to firstly discuss what Bollinger Bands indicator is all about. Bollinger Bands just like other technical indicators is a tool used for technical analysis to measure market volatility and also tell traders about any trading opportunity.
Having discussed what the Bollinger Bands indicator is all about let's go ahead to discuss the three main components of the indicator which are the simple moving average (SMA), the upper band, and the lower band. I will discuss each of them one after the other below also talk about how each component contribute to understanding market volatility and making trading decisions.
1. Simple Moving Average (SMA)
One of the major components to consider in the Bollinger Bands indicator is the Simple Moving Average (SMA) which is the central line in the indicator and it usually uses the 20-days period for the sole purpose of smoothing the fluctuations that happens in short term.
Contribution to Analysis: It is the sole responsibility of the SMA to tell traders the direction of the market or trend when used on the Bollinger Bands indicator. If price is seen above the SMA, it indicates a potential uptrend in thesame way if price is seen below the SMA it indicates a potential downtrend.
Also, when the price gets to the upper and the lower band of the indicator, it then indicate an overbought and an oversold of the said asset respectively.
2. Upper Band
Upper band of the Bollinger bands indicator is as a result of variation from the SMA which means that a number two is always added to the standard deviation of the SMA and when this is done, the price either expands or contract based on the volatility of the market at that point and time.
Contribution to Analysis: Just as earlier explained above, the upper band serves as a resistance level and a region of overbought. Once price reaches this level, it implies that the market is overbought which means that there are possibilities of the market pulling back to the opposite direction.
3. Lower Band
Lower band of the Bollinger bands indicator is as a result of variation from the SMA which means that a number two is always subtracted to the standard deviation of the SMA and when this is done, the price either expands or contract based on the volatility of the market at that point and time.
Contribution to Analysis: Just as earlier explained above, the Lower band serves as a support level and a region of oversold. Once price reaches this level, it implies that the market is oversold which means that there are possibilities of the market pulling back to the opposite direction.
How Each Component Aids in Trading Decisions
Basically there are 3 ways which these components aids in trading decisions are this include volatility, breakout and mean reversion. I will explain better below.
Volatility: In this scenario, we see that there is a widen range between the upper and the lower band when the volatility is high and you see it compress when the volatility is low. The high volatility identify that the price of the asset is moving and may result to a breakout whereas the low volatility implies that there is a consolidation about to take place.
Breakouts: When we notice a movement above or below the upper or lower band, we will then be sure that a breakout is about to happen. So the trend movement above the upper band shows an uptrend movement whereas the trend movement below the lower band shows a downtrend movement.
Mean Reversion: When the price of the asset reaches the upper or lower band, it is expected to revert back to the SMA and while on the SMA, a trader can decide to enter or exit the market during that period.
| Question 2: Analyzing Market Conditions with Bollinger Bands |
|---|
Using a historical chart of Steem/USDT, analyze market conditions based on Bollinger Bands. Explain if the market is in an overbought, oversold, or neutral state. Provide examples of how Bollinger Bands can signal potential buying or selling opportunities.
Based on the historical data chart of Steem/USDT, I want to share with us regions of Overbought, Oversold and Consolidation which is a neutral state of the market. Recall we talked about contraction and expansion, I said earlier when there is expansion, you will notice price of asset moving towards the upper or lower band and the distance between them will be much indicating an overbought or oversold. In the same way, when there is contraction it means there is consolidation.
Overbought Condition: Considering the screenshot below, we have taken into account a 4H timeframe of the pair of STEEMUSDT and from the screenshot you will notice that the price consistently touches the upper band which indicates that there is a strong buying pressure and that there possibilities that there will be a pull back or breakout soon.
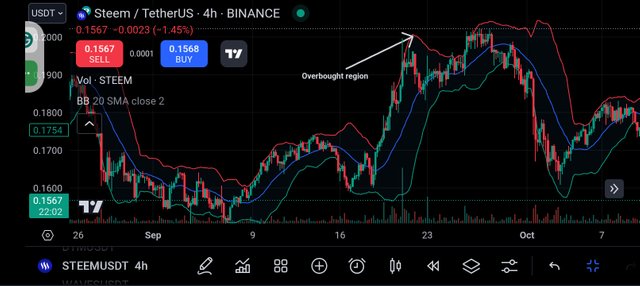
When you see the market in such a situation all you need to do is to wait for either a breakout or a pull back to make an informed trading decisions because you are faced with two possibilities here i.e the possibilities of the price breaking above the upper band and the possibility of the price pulling back.
Oversold Condition: Considering the screenshot below, we have taken into account a 4H timeframe of the pair of STEEMUSDT and from the screenshot you will notice that the price consistently touches the lower band which indicates that there is a strong selling pressure and that there possibilities that there will be a pull back or breakout soon.
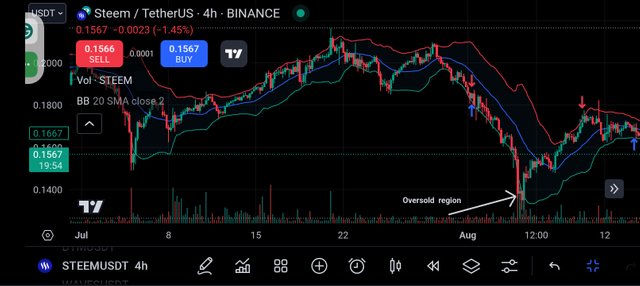
When you see the market in such a situation all you need to do is to wait for either a breakout or a pull back to make an informed trading decisions because you are faced with two possibilities here i.e the possibilities of the price breaking below the lower band and the possibility of the price pulling back.
Neutral or Consolidation State: From the below screenshot you will also notice that there is a very large contraction and the price is just wovering around the SMA.
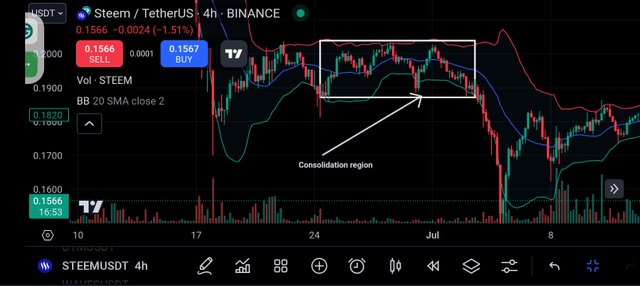
From the screenshot, the price goes up and come down and settles within the centre showing clearly that it is consolidating. Here traders needs to be careful and wait for a complete breakout before making any decision of buying or selling the assets.
Example Application
Considering the screenshot below, you can see that the price was seen below the SMA which implies that the price of the asset may be going downward. With the expansion of the upper and the lower band you will also ascertain that the price is not in consolidation but going downward hence a trader may choose to enter a sell order at that point after the closure of the first candle below the SMA.
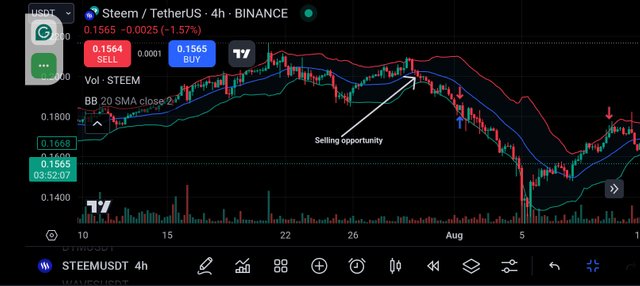
As predicted, you can see that the asset continued moving downward and continued having contact with the lower band as the market keeps going downward. So that is how you can dictate a buying or selling entry using the Bollinger bands.
| Question 3: Identifying Volatility Patterns with Bollinger Bands |
|---|
Explain how Bollinger Bands indicate market volatility. Use a real example of Steem price action where the bands expanded or contracted, signaling a potential breakout or trend change.
As I said earlier in this post, the Bollinger bands is used to measure market volatility and trend change. We also established that when there is expansion of the bands i.e., the lower and the upper it implies that the volatility is high and when there is contraction it implies that the volatility is low. In all price movement and deviation from the SMA is always taken into consideration as explained earlier.
So when we see expansion or contraction, it implies that there are tendencies that there will be breakout or possibly a trend change so you careful observe before making any decision on the trade.
Real Example of Steem Price Action
Band Expansion Signaling a Bullish Breakout
Let's consider the Real life example of the pair of STEEMUSDT on a 4H timeframe where we see band expansion indicating a bearish breakout. At first the said asset just left the SMA where it is seen as a consolidating state and when it moved below it we saw it hitting the lower band over and over again indicating a downtrend.
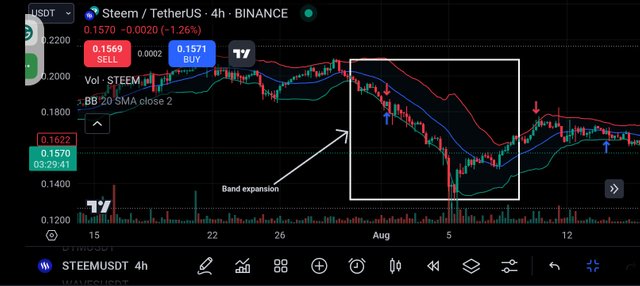
Traders will want to take a sell entry immediately after the closure of the candle below the SMA. So considering the expansion we see after the candle left the SMA we see strong selling momentum since there is a continuous hitting.
Traders are expecting further downward movement and also a trend reversal if the momentum becomes weaken to move further. So that is life analysis about the expansion phase of the pair of STEEMUSDT on a 4H timeframe.
Band Contraction Signaling Potential Trend Reversal
Also considering the screenshot below, you will also notice that the market is in a band contraction where the price is seen as a consolidating phase for a while. The market continued in its phase until a change in trend took place where the trend moved from bearish to bullish.
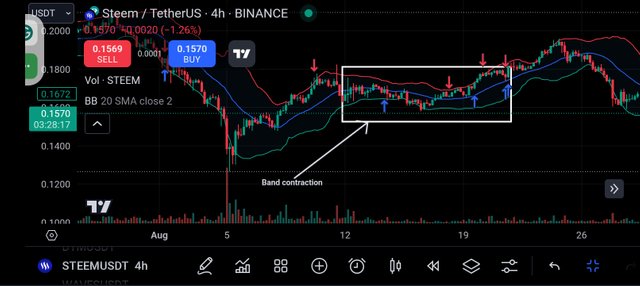
Seeing the above chart, you will notice that the price was initially consolidating and in a little downtrend before we saw a sudden trend change to the upward direction after the breakout of the SMA.
| Question 4: Developing a Trading Strategy with Bollinger Bands |
|---|
Create a trading strategy using Bollinger Bands for the Steem token. Describe entry and exit points based on band interactions, such as price touchpoints or midline crossings. Support your strategy with a real chart example.
Using the Bollinger bands we can easily spot the levels for entry and exit for any asset especially the Steem token as taken into consideration. I will explain how these can be done and also use a live chart for my illustration. So these process is the trading strategies I have develop for myself.
p
Entry and Exit Points
1. Buy Signal (Long Entry)
Firstly confirm and be certain that the price of the Steem falls below the Bollinger bands showing clearly that the said asset may be oversold. When the momentum for a downward movement is weak, you will have to identify that and be sure that downward movement has come to an end.
When the price starts moving above the lower band, you get yourself ready I don't recommend jumping into the market at this point so I recommend you wait for the price to move above the SMA which shows that a change in trend has taken place completely. Immediately after the closure of the first bullish candle above the SMA you can enter a long or buy for the asset.
2. Sell Signal (Short Entry)
Similarly, just as explained in the buy case the reverse is the case for the sell side as well. Confirm and be certain that the price of the Steem is above the upper Bollinger bands showing clearly that the said asset may be overbought. When the momentum for a upward movement is weak, you will have to identify that and be sure that upward movement has come to an end.
When the price starts moving below the upper band, you get yourself ready for the trade, I don't recommend jumping into the market at this point so I recommend you wait for the price to move below the SMA which shows that a change in trend has taken place completely. Immediately after the closure of the first bearish candle below the SMA you can enter a short or sell for the asset.
3. Take Profit and Stop Loss
Take Profit:
In the case of the long position or buy you are expected to take profit and exit the market when the price of the asset start touching the upper band.
Similarly, in the short position or sell you are expected to take profit and exit the market when the price of the asset start touching the lower band.
Stop Loss:
Set your stop loss for those who take a long (buy) entry below the the last lower low before you entered the market.
In the same way for short entry (sell) setup your stop loss above the last higher high before your entry.
Example Strategy in Action
Long Setup: Let's consider the screenshot of the buy order below as we apply the strategy I have explained above. As you can see clearly, before entering long, the price of the asset moved towards the upward directions above.
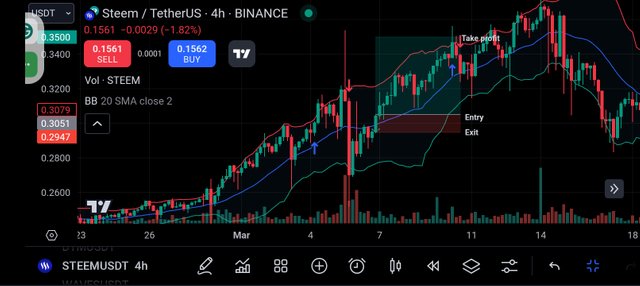
When the candle above the SMA closed, I decided to immediately introduce my buy logo as seen in the screenshot. My entry is seen at the beginning of the next candle and my stop loss which is the exit point was seen below the last candle before the entry point.
The take profit as you can see is spotted when the asset hit the upper band. So these is how to trade your asset using this very indicator.
Short Setup: Let's consider the screenshot of the buy order below as we apply the strategy I have explained above. As you can see clearly, before entering short, the price of the asset moved towards the downward directions above the SMA.
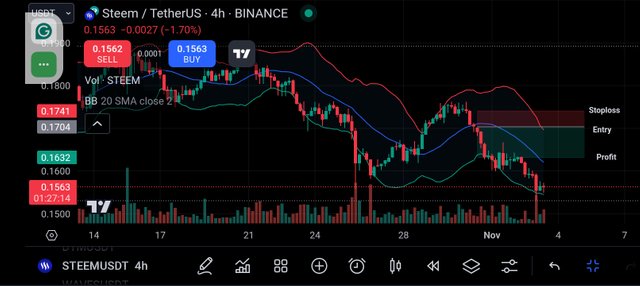
When the candle below the SMA closed, I decided to immediately introduce my sell logo as seen in the screenshot. My entry is seen at the beginning of the next candle and my stop loss which is the exit point was seen above the last candle before the entry point.
The take profit as you can see is spotted when the asset hit the lower band. So these is how to trade your asset using this very indicator.
| Question 5: Predicting Price Movements with Bollinger Bands |
|---|
Apply Bollinger Bands to forecast future price movements of Steem. Discuss how the bands’ positions and movements suggest potential support and resistance levels and what these predictions imply for Steem's upcoming price behavior.
We have already applied Bollinger bands on the analysis we have been doing from the very beginning but this time we want to apply it at the most current chart to be able to dictate the future movement of the Steem token. Now let's see how these goes.
As you know already, expanding bands means that the volatility is high whereas contrasting bands means that the volatility is low. So having this knowledge in mind we can then proceed to discussing the support and resistance and how this bands serves them.
The upper band serves as dynamic resistance level for the asset whereas the lower band serves dynamic support level for the asset. When the price of the assets hit the upper or the lower band it signifies overbought and oversold level respectively.
Also crossing the SMA above or below also passes a lot of mesaage to the trader as explained above. Before taking a buy entry, you must make sure that the price of the asset moves above the SMA and for a sell, you must ensure that the price moves below the SMA. So having discussed all of these let's consider the price of Steem at the moment and then decide if the future price will go up or down.
Example Forecast Using Current Bollinger Band Positioning
Let's consider the screenshot below. This is the current price chart of Steem as at the time of writing this post. I'm using a 4H timeframe chart to perform my analysis. So let's go ahead and look closely at the chart.
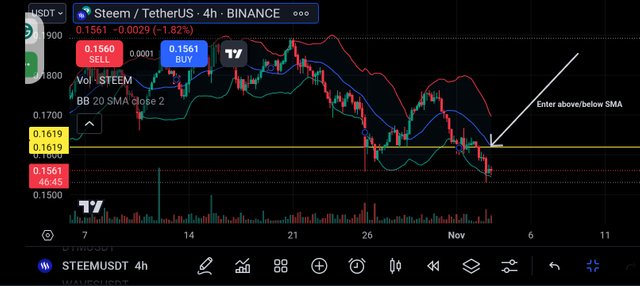
From the chart you will notice that the price of the asset at the moment is in its oversold because we have seen it hitting the lower band for a while but we are also seeing a bullish candle forming which means that the momentum of the downtrend is coming to exhaustion hence we are expecting a complete reverse in the trend to an upward direction but we can't conclude until we have a clear confirmation and that is the price moving above the SMA.
Now from my analysis, it is not proper to enter the market at this stage. Because there are two tendencies which are the price going upward or breaking the lower band to move downward. Hence I have put in a line which if the price moves upward and breaks it will be breaking the SMA and in that stage it is just to enter a buy order but if it goes up and didn't break the SMA and it drops again then a sell order can be entered as well.
So at the moment, I want to say that the currently future of Steem maybe bullish because the bearish trend is already getting weak considering the movement now.
Finally, I want to invite @suboohi, @josepha, and @ripon0630 to also join the contest and share with us their thoughts on Mastering Steem Market Volatility Using Bollinger Bands.

