It's week 4 of the Steemit engagement challenge for season 19 and I'm delighted to share my participation on the topic which talks about Mastering the Sharkfin Model for Trading. Here in this contest, I will share with you my understanding of the topic based on the questions given below and also add additional information that is always necessary.
Background image Edited on Canvas
The concept of the Sharkfin model came from two words i.e., Shark and its Fin. We all know how important the fin of a shark is. Over the years research has shown that humans are more interested in the fin of a shark than the Shark itself. Without further ado let's go into the discussion of the day as I try to provide valuable answers to the questions below.
| Explain the concept of the Sharkfin model. What is a Sharkfin pattern and how can it be identified on a price chart? Describe its main visual characteristics. |
|---|
One of the most used patterns in technical analysis to spot potential trend reversal of assets in the financial market is the Sharkfin model. As the name implies Sharkfin, the pattern always appears like the shape of a shark fin. In this pattern or model, there is always a sharp move in the price of an asset and a quick reversal back to the original level of the price.
This means that if the price is in a downtrend, you can witness a sudden rise to an uptrend and a quick decline back to a downtrend and verse versa. So this sharp movement takes the market to its overbought and its oversold regions respectively.
Sharkfin Pattern and how can it be identified on a price chart.
As explained above, the sharkfin pattern is a pattern that helps traders spot trend reversals in the market. There are many things we take into consideration when identifying this pattern and the basic ones can be seen below.
Quick Rise or Fall: Firstly, to identify this pattern, you must look for an asset that has made a sharp movement either upward or downward. So the movement must begin with a sharp movement upward or downward, this tells you that what you see may be a Sharkfin Pattern.
Peak or Trough: After the sharp move, the market gets to a level where it doesn't move upward again in the case of bullish movement and this point is called the ATH (Peak) of the pattern at that moment or the market gets to a level where it doesn't go lower again in the case of bearish movement and that point is called the ATL (Trough) at that moment.
Quick Reversal: When the price reaches its ATH (Peak) or ATL (Trough) in a given movement, you will see a quick reversal of that movement taking the price back to its original level or within its original level before the movement. Seeing this, you will also have gotten another confirmation that the partner is a Sharkfin model.
Volume of assets: Due to the sharp or quick movement in the price of the assets, you will notice an increase in volume either downtrend or uptrend, and when the price is reversing to its initial position the volume of the asset also adjusts back former stands. So when you see volume makes a significant move for an uptrend or downtrend, it is a confirmation that the pattern is Sharkfin Pattern.
There may be another pattern that helps to identify the sharkfin pattern but these 4 listed above are the most commonly used ones. In summary, to identify the sharkfin pattern, check the sharp rise or fall, peak & trough, the sharp reversal, and also the volume of the assets.
Describe its main visual characteristics.
Just as I have explained above on how it can be identified, the visual characteristics are still the same but for clarity, I will throw more light on it below using the bullish and bearish scenario as case studies.
Bullish Sharkfin:
The main visual characteristics of a bullish Sharkfin Pattern are
Sharp upward movement: Here the price of the asset rises fast to an ATH (Peak) at that point and time i.e., within the period of the movement.
Peak: The ATH of the market within the sharp movement is another visual characteristic that is seen. So when the market moves upward and gets to the peak it is a confirmation that the movement is a bullish Sharkfin.
Quick reversal: This is another major visual characteristic that can be seen in the bullish Sharkfin Pattern. After the upward movement to the peak, you will notice a sudden decline or drop in the price to its initial or with the initial price.
Bearish Sharkfin:
The main visual characteristics of a bearish Sharkfin Pattern are
Sharp downward movement: Here the price of the asset falls fast to an ATL (Trough) at that point and time i.e., within the period of the movement.
Trough: The ATL of the market within the sharp movement is another visual characteristic that is seen. So when the market moves downward and gets to the trough it is a confirmation that the movement is a bearish Sharkfin.
Quick reversal: This is another major visual characteristic that can be seen in the bearish Sharkfin Pattern. After the downward movement to the Trough, you will notice a sudden rise in the price to its initial or with the initial price.
| Explain how the RSI (Relative Strength Index) indicator can be used to identify Sharkfin patterns. Give a real-world example of RSI metrics (like overbought and oversold levels) and explain how these metrics help spot Sharkfins. |
|---|
Before I go ahead to explain how the RSI (Relative Strength Index) indicator can be used to identify Sharkfin patterns, I will want us to go through the overview of what this RSI indicator is all about.
One of the most used momentum-based indicators is the Relative Strength Index (RSI). This indicator is used purposely to determine the speed and the change in the price movement of an asset. It is one of the most used technical indicators in the financial market as it talks about the overbought and oversold of an asset allowing traders to know the next expected movement of the asset.
The Relative Strength Index (RSI) indicator ranges from 0 to 100 and these numbers are used to represent the overbought and oversold regions we will see subsequently as we progress how they help us to identify the sharkfin pattern in our trades.
Using RSI to identify the sharkfin pattern
To properly identify Sharkfin Pattern using the RSI one must know how to read the range in the RSI indicator i.e., 0 to 100. So a little breakdown of how this range works can be seen below. I will discuss both for the overbought and oversold.
Identify the sharkfin pattern using RSI Overbought
Overbought: The RSI indicates says when the price of the asset is above the 70 RSI level, it implies that the asset is overbought and this occurs when the price of the asset has reached its ATH within that movement cycle and it also means that the price will need to reverse downward. Below are what we must check for
Sharp movement of price above the 70 RSI level which means that there is a strong uptrend movement.
Hitting an ATH within the cycle of the movement which is the peak based on the sharp movement we saw above.
Sharp reversal of the price towards the centre which is usually around 50 RSI level and also moving towards the initial price. When this happens you will know that the sharkfin cycle pattern has completed its moves.
Identify the sharkfin pattern using RSI Oversold
Oversold: The RSI indicates says when the price of the asset is below the 30 RSI level, it implies that the asset is oversold and this occurs when the price of the asset has reached its ATL within that movement cycle and it also means that the price will need to reverse upward.
Sharp movement of price below the 30 RSI level which means that there is a strong downtrend movement.
Hitting an ATL within the cycle of the movement which is the trough based on the sharp movement we saw below.
Sharp reversal of the price towards the centre which is usually around 50 RSI level and also moving towards the initial price. When this happens you will know that the sharkfin cycle pattern has completed its moves.
Give a real-world example of RSI metrics (like overbought and oversold levels) and explain how these metrics help spot Sharkfins.
Bullish Sharkfin Real world example
We are going to be looking at a live chart on this but before we do, let's look at the theoretical review of a real-world example of the RSI metrics. We are going to first consider the overbought i.e. the Bullish Sharkfin.
If for example, the price of Steem is trading at $0.3 and suddenly we see it jump from $0.3 to around $0.5, before this movement, the RSI indicator was also around the 50 level and immediately when the price jump from $0.3 to around $0.5 the RSI also moved and was spotted around 79-85 which are overbought regions.
At $0.5, which is the ATH the price started reversing and the RSI also started moving downward. When the price gor to around $0.33, the RSI came back to around 50 level. Seeing the example illustration, you will agree with me that the sharkfin cycle has been completed. So we have sharp rise and quick reversal of the price of Steem and the RSI indicator.
Bearish Sharkfin Real world example
Haven seen the bullish Sharkfin real world example where I theoretical explained and also gave a chart example let's consider the bearish. We are going to consider the oversold i.e. the Bearish Sharkfin.
If for example, the price of Steem is trading at $0.3 and suddenly we see it decline from $0.3 to around $0.15, before this movement, the RSI indicator was also around the 50 level and immediately when the price drops from $0.3 to around $0.15 the RSI also moved and was spotted around 15-20 which are oversold regions.
At $0.15, which is the ATL the price started reversing and the RSI also started moving upward. When the price got to around $0.29, the RSI came back to around 50 level. Seeing the example illustration, you will agree with me that the sharkfin cycle has been completed. So we have sharp drop and quick reversal of the price of Steem and the RSI indicator.
| What are the trade entry criteria when using the Sharkfin model applied to the Steem token? Describe the specific signals you are looking for before entering a position, using example price setups and indicators. |
|---|
As a trader, before entering the market, you must check the entry criteria so that you don't lose your money in the process of trading. You need to do your analysis both fundamental and technical analysis and also do all possible research.
You are doing this because it involves money. So any mistake you make during your entry into the market will cost you a lot. So that being said, below are the entry criteria when using the Sharkfin model to trade the Steem token. We are still going to look at the bullish (buying) criteria and the bearish (Selling) criteria.
Bullish (Buying) Sharkfin Pattern Criteria
The trade entry criteria for bullish (buying) or going long on the Steem token must always follow the basic steps listed below to maximize profit and minimize loss.
The sharp price rise must be identified and taken into consideration. For instance, the price moves fastly from its initial price of $0.15 to a new price of $0.33
Using the RSI indicator on such a trade, you are expected to check if the RSI level is above 70 which is a region that indicates overbought.
Ensure that the peak of the price is reached and the reversal in the price movement is visible. This tells you that the ATH of the asset within that cycle has been achieved.
Since you applied the RSI indicator to the chart, you will need to keep an eye on it to be sure that it is also declining and going towards the 50 level which is the center. This means that as the price drops the RSI also is expected to drop.
Take into consideration where the price of the asset decides to settle without further decline, this is always a support region. It is expected that the price should settle within $0.16 or thereabout based on the price sample we have taken into consideration.
If you have confirmed that the decline of the asset movement is over, you will need to look for a good entry position to long the market at that time.
For instance, the price's downward movement stopped at $0.16 which is a support level, you will have to wait and ensure that the downtrend movement is over by allowing the market to move upward to around $0.175 then you can take a long position at that point. If you also check the RSI, it should be around 45-55 during that time before entering the trade.
Bearish (Selling) Sharkfin Pattern Criteria
The trade entry criteria for bearish (selling) or going short on the Steem token must always follow the basic steps listed below to maximize profit and minimize loss.
The sharp price fall must be identified and taken into consideration. For instance, the price moves fastly from its initial price of $0.33 to a new price of $0.15
Using the RSI indicator on such a trade, you are expected to check if the RSI level is below 30 which is a region that indicates oversold.
Ensure that the trough of the price is reached and the reversal in the price movement is visible. This tells you that the ATL of the asset within that cycle has been achieved.
Since you applied the RSI indicator to the chart, you will need to keep an eye on it to be sure that it is also moving upward and going towards the 50 level which is the center. This means that as the price goes up the RSI also is expected to go up.
Take into consideration where the price of the asset decides to settle without further upward movement, this is always a resistance region. It is expected that the price should settle within $0.30 or thereabout based on the price sample we have taken into consideration.
If you have confirmed that the upward movement of the asset is over, you will need to look for a good entry position to short the market at that time.
For instance, if the price's upward movement stopped at $0.30 which is a resistance level, you will have to wait and ensure that the upward movement is over by allowing the market to move downward to around $0.28 then you can take a short position at that point. If you also check the RSI, it should be around 45-55 during that time before entering the trade.
Describe the specific signals you are looking for before entering a position, using example price setups and indicators.
Before entering a position, the specific signals I will look out for concerning price setups and indicators can be seen below. For Clarity, I will show that buying and selling differently.
Bullish (Buying) Sharkfin Setup: The summary of the major things to consider is the rise in price, RSI, and the peak level as well as a reversal. Example
Price moves from $0.15 to $0.30, RSI also moved above 70 to around 85. The ATH was $0.30 at that time and the RSI also was seen at 85 then we saw a sudden reversal of price and the RSI also started dropping.
Here you wait for the reversal to complete before entering the market. You will know that by the explanations I have given in the previous questions. To enter the trade, you wait for any confirmation signal from the candles. Ideally, a price higher than its initial price when the market started exhibiting that pattern.
Bearish (Selling) Sharkfin Setup: The summary of the major things to consider is the fall in price, RSI, and the trough level as well as a reversal. Example
The price moved from $0.30 to $0.15, RSI also moved below 30 to around 20. The ATL was $0.15 at that time and the RSI also was seen at 20 then we saw a sudden reversal of price and the RSI also started rising.
Here you wait for the reversal to complete before entering the market. You will know that by the explanations I have given in the previous questions. To enter the trade, you wait for any confirmation signal from the candles. Ideally a price lower or within the range of the initial price when the market started exhibiting that pattern.
| Describe the trade exit criteria for a Sharkfin model applied to the Steem token. What signals or conditions tell you it is time to exit a position? |
|---|
In other to use the sharkfin model to exit a trade a few criteria must be taken into consideration. Now in the case of our dear Steem token let's look at the bullish Sharkfin exit criteria below.
Bullish Sharkfin Trade Exit Criteria:
You must have a target level. This level should be based on the previous ATH or resistance point that the sharkfin cycle has which prompted you to take the trade.
Be sure to monitor the RSI and exit the trade when the price is spotted above 70 RSI which is the overbought region.
Also check for a possible reversal signal from the candles. When you see a bearish reversal candle formed at the resistance level you must exit the trade.
Also a Trailing Stop-Loss of at least 5% should be set since you can not always be in the market. What this stop loss does for you as a trader is that it will always be 5% below the current price of the asset. If the market keeps going up, it will continue adjusting upward and anytime the price comes downward to that 5% the trade will automatically exit helping you to secure some profit.
The last but not the least criteria to apply is checking for the volume of the asset. If the price is going upward and volume is coming downward then you may need to exit the trade because it shows that market reversal will take place at any moment.
Bearish Sharkfin Trade Exit Criteria:
You must have a target level. This level should be based on the previous ATL or support point that the sharkfin cycle has which prompted you to take the trade.
Be sure to monitor the RSI and exit the trade when the price is spotted below 30 RSI which is the oversold region.
Also check for a possible reversal signal from the candles. When you see a bullish reversal candle formed at the support level you must exit the trade.
Also a Trailing Stop-Loss of at least 5% should be set since you can not always be in the market. What this stop loss does for you as a trader is that it will always be 5% above the current price of the asset. If the market keeps going down, it will continue adjusting downward and anytime the price comes upward to that 5% the trade will automatically exit helping you to secure some profit.
The last but not the least criteria to apply is checking for the volume of the asset. If the price is going downward and volume is going upward then you may need to exit the trade because it shows that market reversal will take place at any moment.
What signals or conditions tell you it is time to exit a position?
All the criteria mentioned above for both the bullish and the bearish Sharkfin exit tell me that it is time to exit the position. So in summary for a bullish Sharkfin exit, enter a long for instance at $0.15 and have your target at $0.3. Watch the RSI and exit if it goes above 70, also be sure to check for a bearish signal formed especially in the ATH or resistance point. Set a trailing stop loss and also check the volume.
Similarly, for a bearish Sharkfin exit, enter a short for instance at $0.3, and have your target at $0.15. Watch the RSI and exit if it goes below 30, also be sure to check for a bullish signal formed especially in the ATL or support point. Set a trailing stop loss and also check the volume.
| Show a detailed example of a transaction based on the Sharkfin model on the Steem token. Use real charts and historical data to illustrate your trade, including entry and exit points, and the reasoning behind each decision. |
|---|
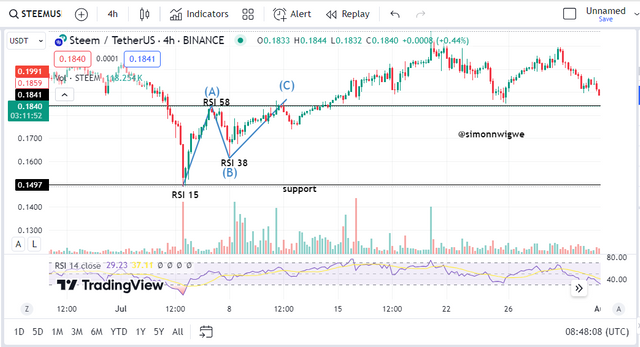
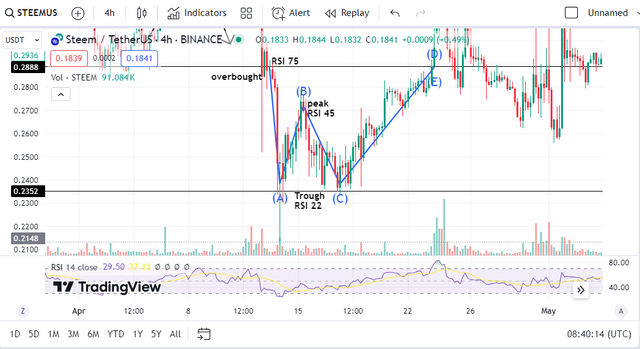
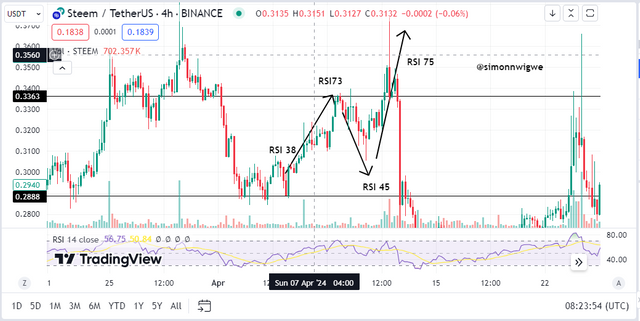
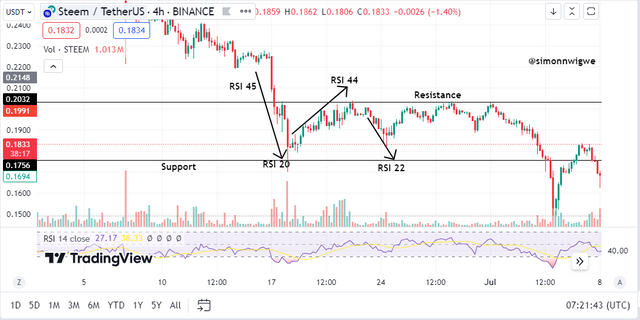
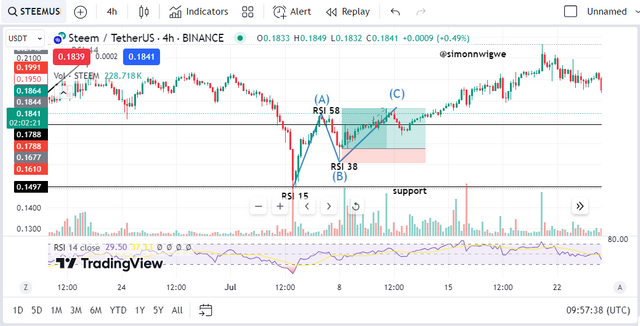
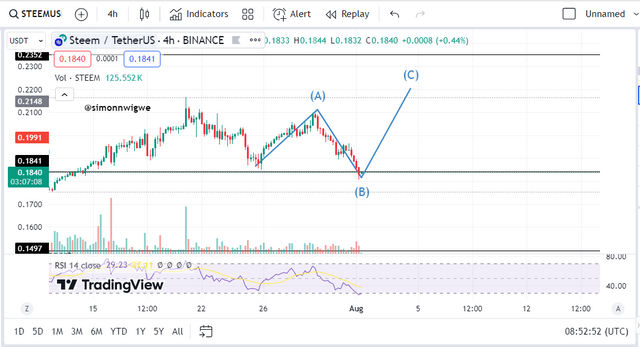
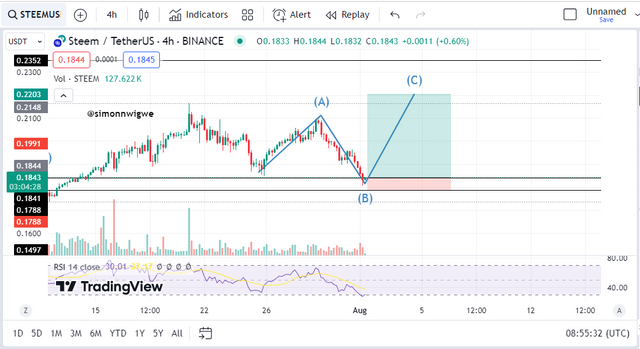
From the screenshot below I want to use the sharkfin model to long the Steem token after carrying out my analysis. Firstly, the RSI was seen around 34 and the price of the Steem token was at $0.18 sudden we saw a quick move which pushed the price to $0.21 and the RSI moved to 68 then a sudden decline back to its initial level when price hit $0.18 again that level acted as support level.
To long the market, I waited for the closure of the 4H bullish candle when the price moved above $0.18 and was seen at $0.185. My target was the resistance level which was $0.21 in the case of the first movement.
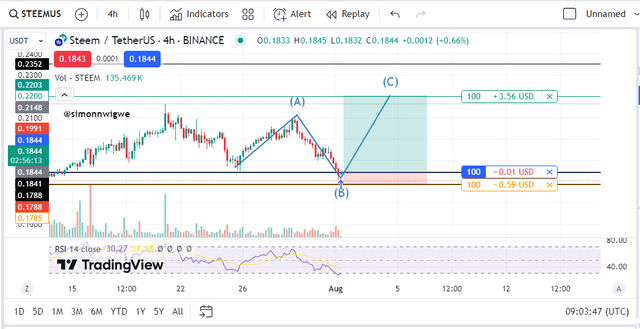
Here I introduced my buy logo and also I ensured that I only risk about 5% of the asset by placing my stop loss at $0.178 and the take profit at $0.21.
To properly keep my heart on the trade I decided to come in with my paper trading i.e demo trade. I have activated the trade as you can see from the screenshot below as it shows that if the trade goes my directions, I will be earning $3.56 and if it goes against me I will loss $0.59.
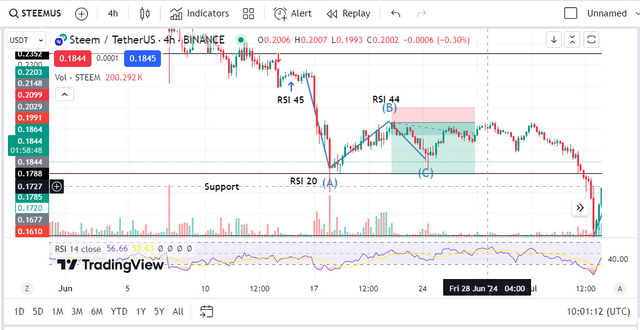
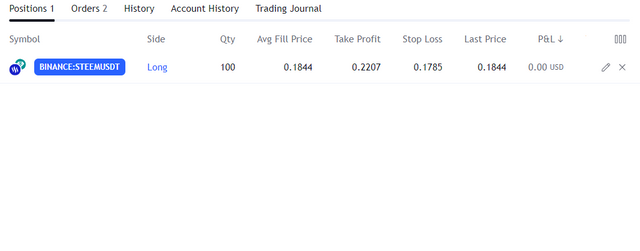
The position of the trade can also be seen below as it captured all the details about the trade I have taken. I entered the market when the price of the asset was at $0.1844 and if the market goes in my favour, it will take profit when the price gets to $0.2207 and if the market goes against me then it will exit when the market drops to $0.1785.
The entry point as you have seen is $0.1844 and the reason was because the 4H bullish candle has closed which is an indication that the downtrend movement has ended and if for any reason it is fake, I also decided to protect my account by placing an exit point which is at $0.1785.
Finally, I want to invite @ruthjoe, @malikusman1, and @ripon0630 to also join the contest and share with us their thoughts about Mastering the Sharkfin Model for Trading.

My best friends , You explain this topic in a very simple way , I love your content and learn many thing from you. best of luck in this contest .
Downvoting a post can decrease pending rewards and make it less visible. Common reasons:
Submit
Thanks my friend
Downvoting a post can decrease pending rewards and make it less visible. Common reasons:
Submit
Thank you, friend!


I'm @steem.history, who is steem witness.
Thank you for witnessvoting for me.
please click it!
(Go to https://steemit.com/~witnesses and type fbslo at the bottom of the page)
The weight is reduced because of the lack of Voting Power. If you vote for me as a witness, you can get my little vote.
Downvoting a post can decrease pending rewards and make it less visible. Common reasons:
Submit
Upvoted. Thank You for sending some of your rewards to @null. It will make Steem stronger.
Downvoting a post can decrease pending rewards and make it less visible. Common reasons:
Submit
THE QUEST TEAM has supported your post. We support quality posts, good comments anywhere, and any tags
Downvoting a post can decrease pending rewards and make it less visible. Common reasons:
Submit
Thanks for the support @sduttaskitchen
Downvoting a post can decrease pending rewards and make it less visible. Common reasons:
Submit
Thank you @simonnewigwe for the detailed guide on the Bullish and Bearish Sharkfin patterns that you have given above. Your explanation clearly elaborates on what should be looked for to determine the reversal signals characteristic of the price change and the RSI. It is correct to say that waiting for confirmation signals from the formation of candlestick patterns is wise. Another way to express it would be to tell you to ‘good job’ or to ‘keep up the good work.
Downvoting a post can decrease pending rewards and make it less visible. Common reasons:
Submit
Thank you my friend. It's good to know and see that you appreciate the work.
Downvoting a post can decrease pending rewards and make it less visible. Common reasons:
Submit
Greetings sir.
It's always a pleasure reading every detail you put out here as I am always learning a lot from your work.
Right on topic. You define sharkfin model, give the various characteristics of sharkfin model. I checked and thats all correct.
Equally your knowledge on RSI and it coalition with sharkfin model to locate ATH and ATL is quite remarkable.
I'm really excited to have come across this post and behold I dissect every section of this work.
It's a proof of solidarity and mastery of the trading craft. Great job done sir.
Good luck 🤞
Downvoting a post can decrease pending rewards and make it less visible. Common reasons:
Submit
Thanks for your valuable comments
Downvoting a post can decrease pending rewards and make it less visible. Common reasons:
Submit
RSI and bullish and bearish markets are very thorough you have shared.Sharkfin was an amazing trading model that based its conditions on Relative Strength Index (RSI) and Bollinger Bands with an aim at giving signals for a reversal in cryptocurrency markets. By identifying such patterns that have an appearance of a shark fin where price jumps to a short level and then falls back, there will be a higher probability of the trader achieving higher returns and thus increase profitability.
Downvoting a post can decrease pending rewards and make it less visible. Common reasons:
Submit
Thanks for your valuable comments on my post my friend. I'm glad you found the post informative
Downvoting a post can decrease pending rewards and make it less visible. Common reasons:
Submit
Great explanation of the Sharkfin model for trading! The detailed steps for identifying and using this pattern, along with the practical examples, are incredibly helpful. Thanks for sharing!
Downvoting a post can decrease pending rewards and make it less visible. Common reasons:
Submit
Thanks for your wonderful comment
Downvoting a post can decrease pending rewards and make it less visible. Common reasons:
Submit
You created very informative post on Sharkfin Model for Trading. Bullish, Bearish, RSI, buy-exit criteria all sections are well written. I am sure the readers can get some key note from this post which can help them to increase their trading understanding based on Sharkfin Model pattern.
Downvoting a post can decrease pending rewards and make it less visible. Common reasons:
Submit
Thanks, dear friend for finding this post educative and informative. I tried to make the explanation straightforward.
Downvoting a post can decrease pending rewards and make it less visible. Common reasons:
Submit