

Hi steemians,
Welcome once again to my blog. This week I am attempting the lecture delivered by professor @sapwood on the topic On-Chain Metrics [Part 2]. In week 1 we discussed Part 1 of this course so this is just continuation of the course.
Welcome once again to my blog. This week I am attempting the lecture delivered by professor @sapwood on the topic On-Chain Metrics [Part 2]. In week 1 we discussed Part 1 of this course so this is just continuation of the course.
1.) What is the difference between Realized Cap and Market Cap, how do you calculate Relized Cap in UTXO accounting structures? Explain with examples.
When we talk about the term Market Cap of an asset, we are simply referring to the product between the price of the asset and the circulating supply of they said assets. That is
Market Cap = Price of asset * Circulation supply
Market Cap = Price of asset * Circulation supply
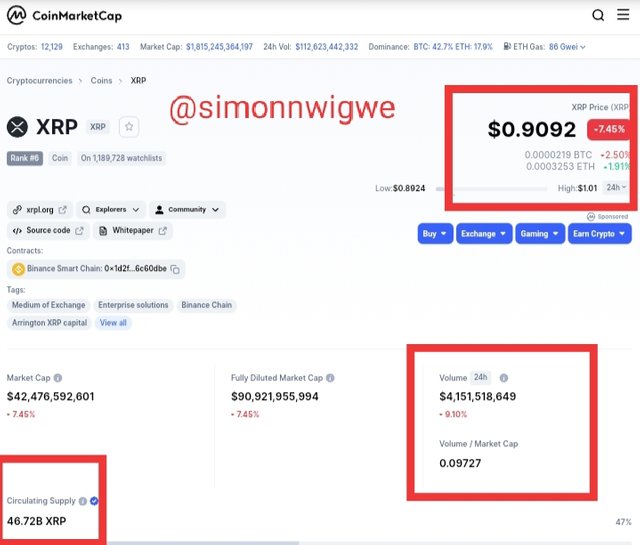
From the screenshot above, let's use it to see how the market capitalization is been calculated. Using XRP coin to perform this analysis, the current price of XRP is $0.9092 and the circulating supply is 46.72B XRP therefore using the relation above, we can say that the Market Cap = $0.9092 * 46.72 = $42.477824
The Realized Cap is slightly different from the Market Cap of an asset because it takes into cognizant the unspent coins UTXO and the time the said asset was last transacted. This means that the realized cap works with UTXO price based on the time it was moved last. That is Realized Cap=Value * Pricecreated [USD] (of all UTXOs)
Example: Let's assume XRP has 15 UTXOs in total with a circulating supply of 15 XRP. Let's say 4 UTXOs have not be moved since 2016(with the price of as $150 on the day it was last moved), 2 UTOXs have not been moved since 2019(with the price as $15,000 on the day it was last moved), 5 UTOXs have not moved since 2021(with the price $35,000 on the day it was last moved)
Then the Realized Cap = (4*150) + (2*15000) + (5*35000)
Realized Cap = 600 + 30000 + 175000
Realized Cap = 205,600 USD.
Realized Cap = 600 + 30000 + 175000
Realized Cap = 205,600 USD.
Similarly, we can use the same method to calculate the Market cap of XRP using the current price $0.9092
Market Cap = 15 * $0.9092 = $13.638
(2) Consider the on-chain metrics-- Realized Cap, Market Cap, MVRV Ratio, etc, from any reliable source(Santiment, Glassnode, etc), and create a fundamental analysis model for any UTXO based crypto, e.g. BTC, LTC [create a model for both short-term(up to 3 months) & long-term(more than a year) & compare] and determine the price trend/predict the market (or correlate the data with the price trend)w.r.t. the on-chain metrics? Examples/Analysis/Screenshot?
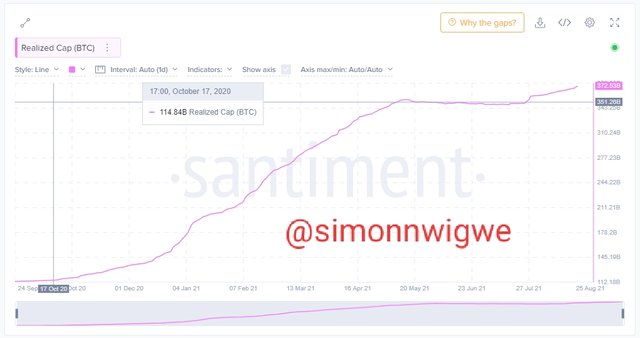
Realized Cap
The Realized Cap is slightly different from the Market Cap of an asset because it takes into cognizant the unspent coins UTXO and the time the said asset was last transacted.
Short Term (3 Months)
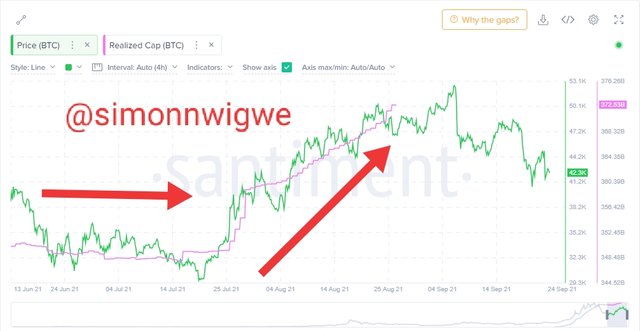
From the screenshot above you will notice that the price of BTC and the realized cap was moving in range through out until it got to 25 July 2021 where the price experienced an uptrend movement. The price from that moment continued experiencing higher high and higher low. When it got to 04 Sep 2021 the prices started experiencing a downtrend. Then we started noticing lower high and lower low till 24 Sep 2021. Within this period, the highest price the coin got to before dropping is around 53.1k but the drop has brought it back to 42.3k. The realized cap moved up to 372.53B
Long Term (3 Years)
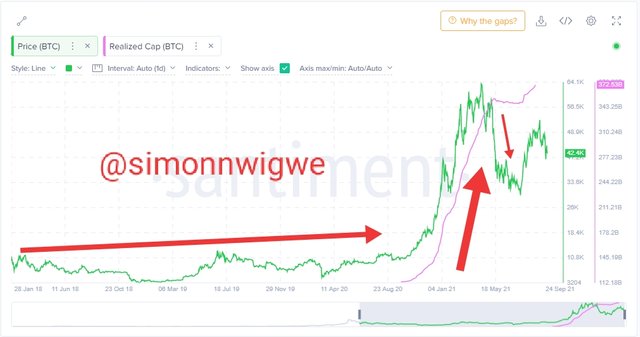
Here there was a range price from the chart seen above from 28 Jan 2018 and it continues that way till it got to 23 Aug 2020 where the realized cap moved upward in line with the price. On getting to the 18 May 2021 there was a serious drop in the price of the asset which ranged from 56.5k down to 33.0k but the realiazed cap kept moving upward not minding the direction of the price. The realized cap move up to 372.53B.
Market Cap
Market Cap of an asset is simply reffered to the product between the price of the asset and the circulating supply of they said assets.
Short Term (3 Months)
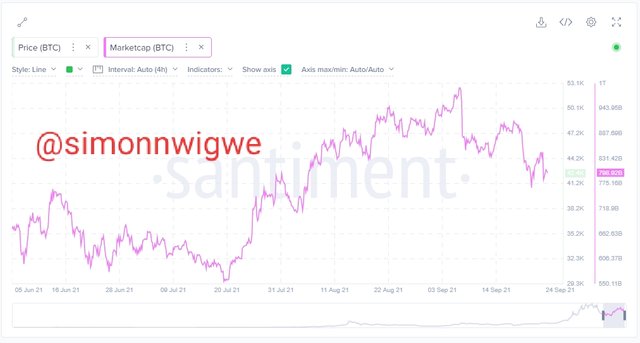
From the screenshot above, you will notice that the market cap and the price of BTC is in a simultaneous movement. From 20 July 2021 you will notice a significant raise in the price of the asset as well as it's market cap. As at 24 Sep 2021 the price was pegged at 42.4k and the market cap is at 798.92B.
Long Term (3 Years)
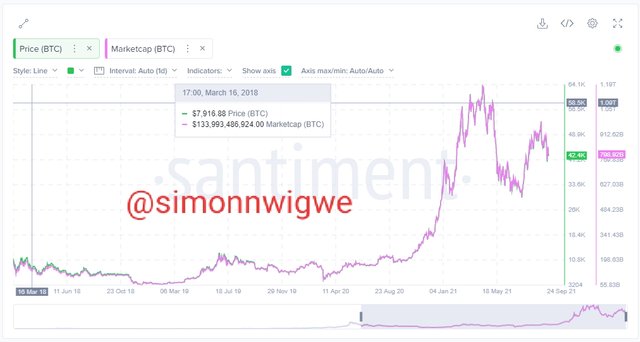
Similarly, in the chart above we can see the movement between the price and the market cap in a simultaneous movement. From 11 June 2018 the price and the market cap continued moving in range. From 11 April 2020 it started experiencing an uptrend until it got to the peak and started falling back from 18 May 2021 within that range of time it started going up again. The current price of the asset as seen in the screenshot is 42.4k and the market cap is 798.92B.
MVRV Ratio (Market Value to Realize Value)
This is one of the on-chain metrics features which is gotten as a result of the division between the market cap and the realized cap. That is the ratio of Market cap to Realized cap is what we know as the MVRV.
Short Term (3 Months)
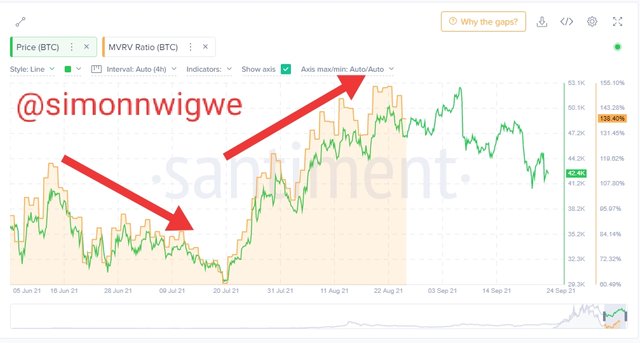
From the screenshot above you will notice the price of the asset is moving in correlation with the MVRV. On the 20 July 2021 you will see a deep drop in the price of BTC I.e 29.3k and price came a little above MVRV from that moment an uptrend started and the MVRV as well as the price of the asset move upward. The present price of the asset as seen in the screenshot is 42.4k and the MVRV is 138.40%
Long Term (3 Years)
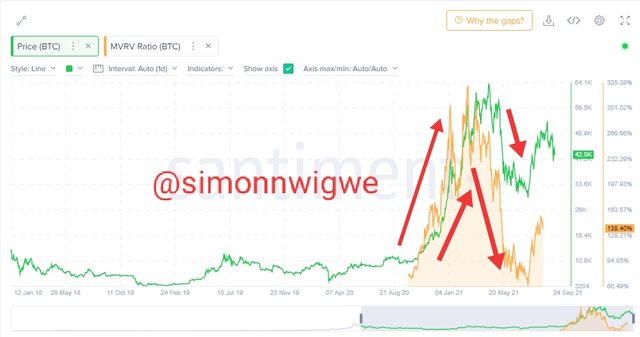
From the screenshot above, you will notice the absent of the MVRV from 12 Jan 2018 this is because it is lower than 0% and it is in downtrend and it showcase it self from 21 August and that help to push the price movement to uptrend direction. Initially it was higher than price but from 20 May 2021 it dropped below price movement. The price of the asset as at 24 Sep 2021 is 42.5k and the MVRV is 138.40%
General Observation
From the chart we have seen above on Realized Cap, Market Cap and the MVRV Ratio (Market Value to Realize Value) we will notice that all these on-chain metrics features are actually useful to analyze the price of any coin. Though considering the two terms I believe that the short term does not give a clear and a reliable signal as the long term does.
(3) Is MVRV ratio useful in predict a trend and take a position? How reliable are the upper threshold and lower threshold of the MVRV ratio and what does it signify? Under what condition the Realized cap will produce a steep downtrend? Explain with Examples/Screenshot?
Yes the MVRV is reliable in the prediction of a trend and taking of position. If the MVRV is seen above 100% and it records higher highs and higher lows we can say it is a good bullish trend and a buy position can be taken at that point. Similarly, when the MVRV is seen below 100% and it records lower low and lower high we can say it is a good bearish trend and a sell position can be taken at that point.
Upper and Lower Thresholds Reliability
Lower threshold
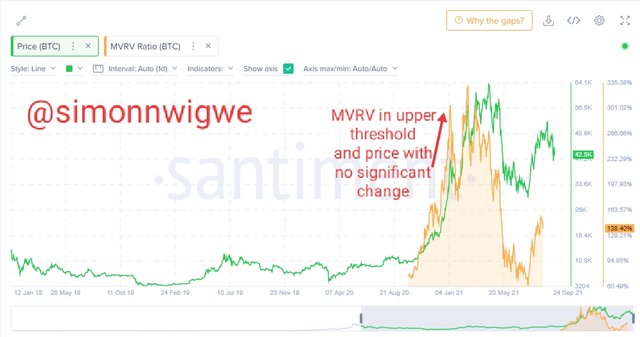
Upper threshold
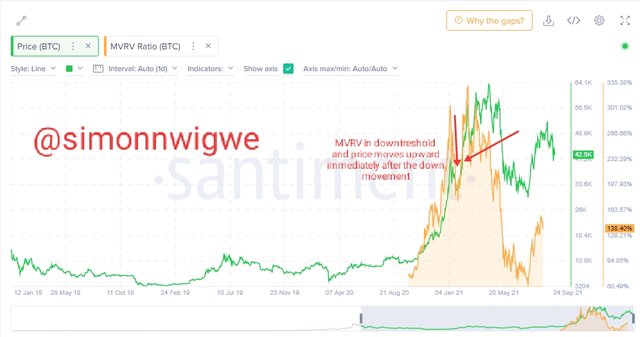
From the charts above, you will notice that the upper threshold does not completely have side effect to the price of the said asset. Upper threshold normal will implies that the price continuous its movement upward. But something unique always happens when ever there is a lower threshold and that is there will always be an uptrend move in the price. So this means anytime where there is lower threshold, it always have an uptrend movement in price after it. So to me the lower threshold is more reliable because anytime it is notice there is always an uptrend move in price immediate after the lower threshold.
Conditions Leading to A Steep Downtrend of the Realized Cap.
To me I believe that the one of the condition that will lead to a steep downtrend of a realized cap is when the masses losses their trust or confidence in the said asset. Take for instance, late last year or earlier this year XRP had an issue that lead to the price drop from around $1.5 to around $0.04 this is as a result of the issue XRP had and most people started losing interest in them.
Conclusion
In summary, there is no doubt that all the on-chain metrics listed above are all use to analyse the price of any asset in the crypto world. We have established that the market cap is the product of price and circulating supply. We also said that the Realized Cap is slightly different from the Market Cap of an asset because it takes into cognizant the unspent coins UTXO and the time the said asset was last transacted. The MVRV is the ratio of Market cap and the Realized Cap. Thank you professor @sapwood for such a wonderful lecture. I do hope to learn more from you in the mext class.
NB: All screenshot where gotten from sentiment and coinmarketcap site
Downvoting a post can decrease pending rewards and make it less visible. Common reasons:
Submit