

Ladies and Gentlemen,
Welcome to season 5 week number 5 once again. Today I will be attempting a homework task given by professor
@sapwood. This is after his lecture on the topic Onchain Metrics Part 3 (GIOM, Adjusted Large Transaction Volume). Have fun as you read through my blog.

(1) What do you mean by Global In/Out of the Money? How is a cluster formed? Explain ITM, ATM OTM, etc with examples?

Global In/Out of the money which is abbreviated as (GIOM) is one among the many on-chain matrices that is used to arrange the crypto asset address in cluster. As we know crypto asset are bought by different people and at different prices and the address which holds these data are different as well. It is the responsibility of the GIOM to arrange these different information in a cluster.
Cluster are in range and it is formed by the purchase price of an asset and the holding of it in the address. Information that are found in the cluster are price range (minimum price and maximum price), volume, average price and the number of address within the cluster.
The major aim of the GIOM is to evaluate the market price I.e the purchase price. It aims to check whether the holding address is in a profit or in a loss. Basically, we have three different categories of clusters I.e In the Money (ITM), Out of the Money (OTM) and At the money (ATM). Let's consider the screenshot below.
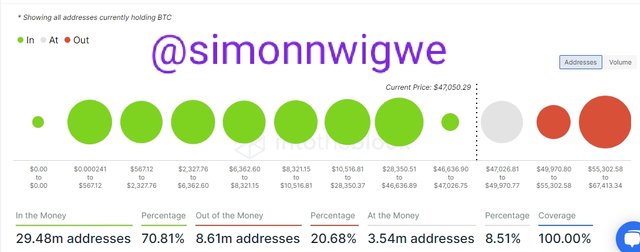
The screenshot above shows a GIOM cluster of BTC. From the screenshot we can see that the addresses present in the money (ITM) is 29.48m and it has total of about 70.81%. In the same way, the addresses present out of the money (OTM) is 8.61m and it has total of about 20.68%. Similarly, the addresses present at the money (ATM) is 3.54m and it has total of about 8.51%.
In the Money (ITM)
This is one of the categories in the cluster. Here in these category the current price of the asset is higher than the price range of the cluster. The ITM is usually green in colour and these region normally acts as a support region for the crypto asset. This simply means that address found here are in profit. Let's see the screenshot of the ITM below.
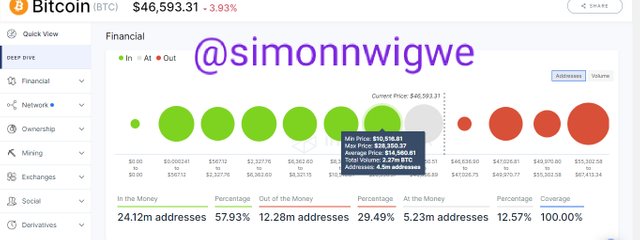
From the screenshot above, one of the ITM cluster was selected as seen above, the information contained include Min Price: $10,516.81, Max Price: $28,350.37, Average Price: $14,560.61, Total Volume: 2.27m BTC and Addresses: 4.5m addresses. From the screenshot we can see that the current price of BTC as at the time of performing this task is $46,593.31 and this is higher when compared to the selected cluster range.
At the Money (ATM)
This is one of the categories in the cluster. Here in these category the current price of the asset is seen within the range of the cluster. This means that the amount use to buy the asset stored in the address is the same within the current price.
The ATM is usually white in colour and these region normally is a region where no profit as well as loss is experience. Let's see the screenshot of the ATM below.
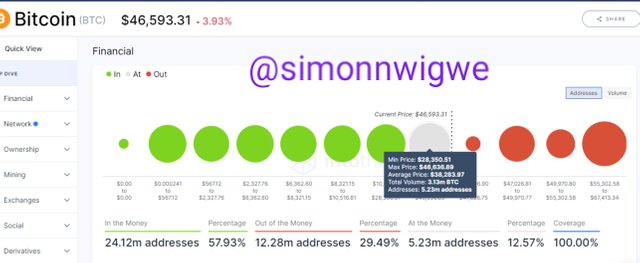
From the screenshot above, the ATM cluster was selected as seen above, the information contained include Min Price: $28,350.51, Max Price: $46,636.89, Average Price: $38,283.97, Total Volume: 3.13m BTC and Addresses: 5.23m addresses. From the screenshot we can see that the current price of BTC as at the time of performing this task is $46,593.31 and this is in a range with the selected ATM cluster.
Out of the Money (OTM)
This is one of the categories in the cluster. Here in these category the current price of the asset is lower when compared to the price range of the cluster. The OTM is usually ref in colour and these region normally is a region of resistance. The address here are in loss. Let's see the screenshot of the OTM below.
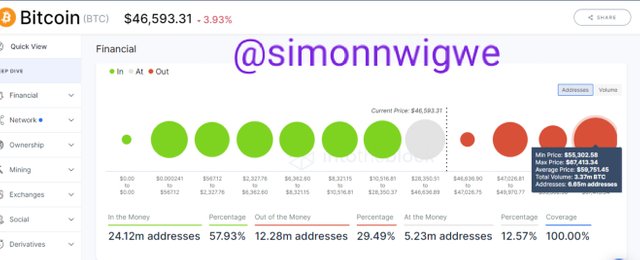
From the screenshot above, the OTM cluster was selected as seen above, the information contained include Min Price: $55,302.58, Max Price: $67,413.34, Average Price: $59,751.45, Total Volume: 3.37m BTC and Addresses: 6.65m addresses. From the screenshot we can see that the current price of BTC as at the time of performing this task is $46,593.31 and this means that the selected cluster is higher than the current price.

(2) Explain about Large Transaction Volume indicator with examples? What is the difference between Total and Adjusted Large Transaction Volume?Examples?

When we talk about the large transaction volume, we are referring to one of the on-chain metrics that is used to keep record of large transactions which are ranging from 100,000 and above. This on-chain metrics tools is mainly use to monitor the movement of transaction from and into the blockchain.
Large transactions volume is normally associated with the whales or large investors of the asset. This means that bulk of transaction has been carried out by the whales or investors which result to inflow of capital or outflow of capital. When the curve (I.e price and volume) is moving in an upward direction it implies that a bigger transaction has been executed within that point in time.
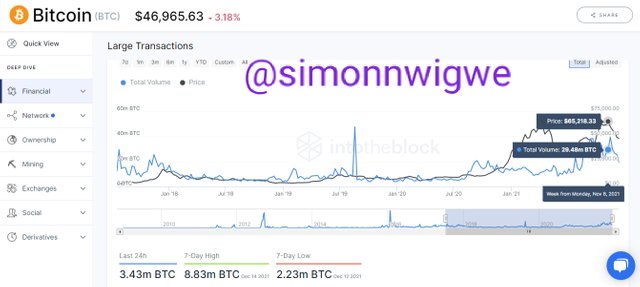
From the screenshot above, as at the week from Monday, Nov 8, 2021 the price of BTC was seen at $65,218.33 and the total volume at that point was 29.48m BTC. From the screenshot, the black zigzag line is use to indicate the price of the asset whereas the blue zigzag line represent the total volume.
What is the difference between Total and Adjusted Large Transaction Volume?
Large Transaction Volume are of two types I.e the Total large transaction volume and the adjusted large transaction volume. Now let's discuss them briefly one after the other.
Total Large Transaction Volume: This type of transaction is so called total because it takes into consideration all large transactions. Here, one transaction can be recorded more than once as transaction can be moved from one address to another and then send back to the initial address. This is a big problem because it can generate false reading to those who are work g on the data. Let's consider the screenshot below.
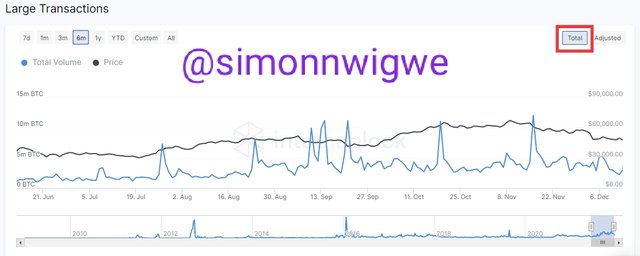
The chart above shows price and volume of the Total large transaction volume and it is a record taken which contains the last 6 months. From the movement of price and volume, you will notice that the volume is not on a constant movement as it goes up and down often.
Adjusted Large Transaction Volume: This type of transaction is so called adjusted because it takes care of the issues associated with the large transaction. So no transaction is to be recorded multiple tomes as in the case of the total large transaction volume. This type of large transaction volume is use to give the accurate result of the happens or transaction on the asset. Let's consider the screenshot below.
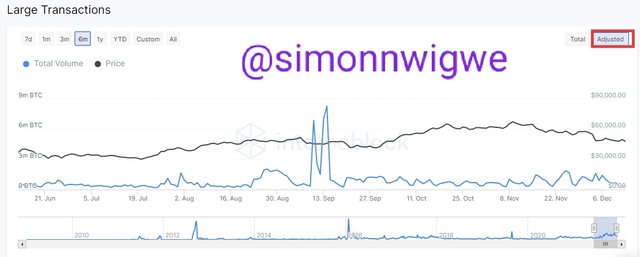
After the performance of all the transaction and then the system has cleared all multiple transaction, as at Sep 14, 2021, the total volume of the asset is 8.3m BTC and the price was at $46,019.97

(3) Analyze a crypto asset(other than BTC) using on-chain metric: GIOM, and Adjusted Large Transaction Volume? Ascertain whether it supports a Bullish or Bearish bias or Neutral? How do you find the support and resistance using GIOM? How do you ascertain the upside/downside momentum using GIOM? Use InTotheBlock app or any suitable app? (Examples/Screenshots)?

Here in this question I will be working with the IntoTheBlock website.
Bullish or Bearish in Short Term
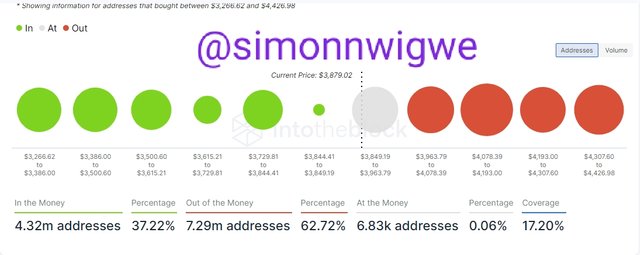
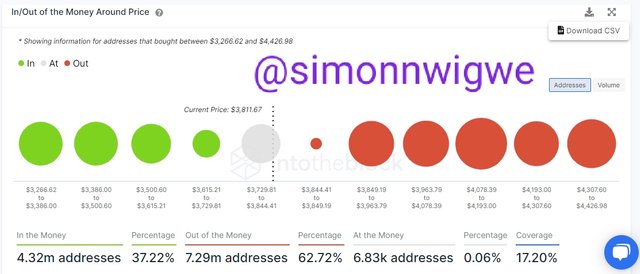
From the image above, the IMT has a percentage of 37.22% and the OTM has a percentage of 62.72%. Here in this case, the trade is not very clear as traders will be waiting for a wider difference before entering the trade. But the trade is likely to be bullish.
Bullish or Bearish in Long term
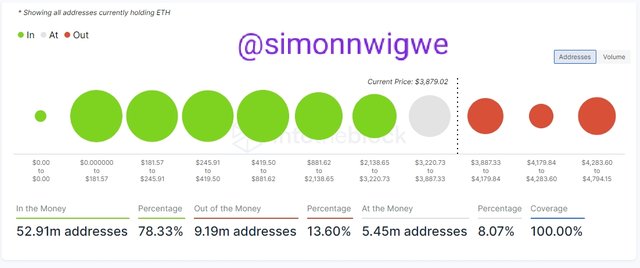
From the screenshot above, the IMT has a percentage of 78.33% and the OTM has a percentage of 13.60%. This clearly indication of bullishness in the price of the asset.
Support and Resistance level for Short Term
I clicked on the download icon as indicated in the screenshot above to download the raw data.
My data was viewed from MS Excel as seen below.
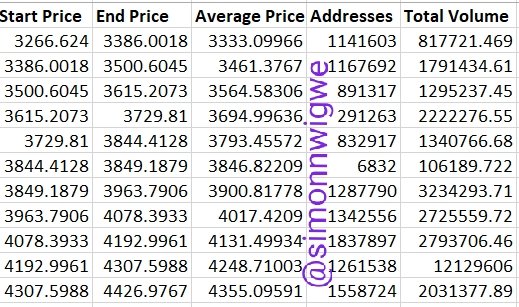
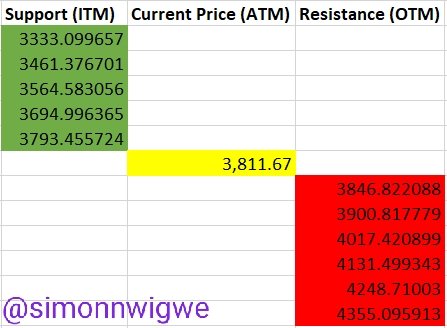
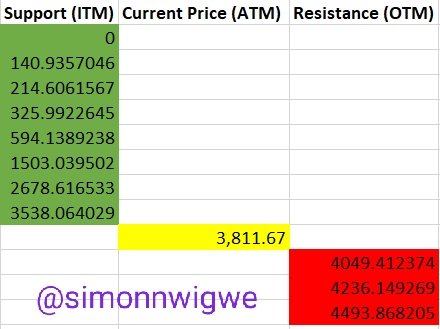
From the above data, I was able to extract the support and resistance levels from the averages. The levels are seen in the screenshot below.
Support and Resistance level for Long Term
I clicked on the download icon as indicated in the screenshot above to download the raw data.
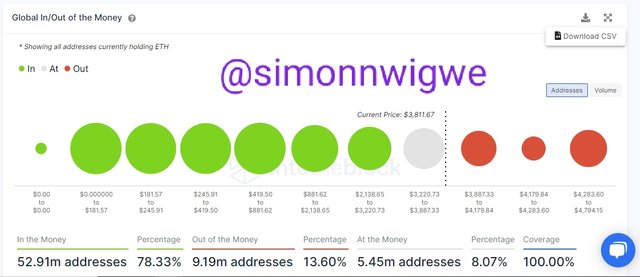
My data was viewed from MS Excel as seen below.
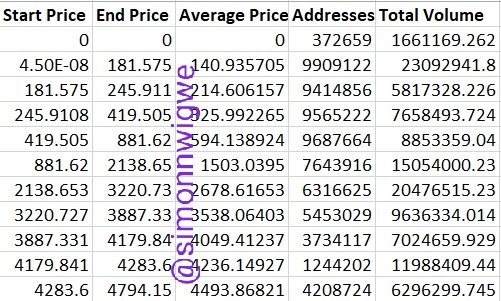
From the above data, I was able to extract the support and resistance levels from the averages. The levels are seen in the screenshot below.
Momentum Using GIOM
In other to spot the momentum, the price range is suppose to be equal. So for this part of the question, I am selecting a range of price of $3,900 and $4,000. Let's consider the first case scenario.
Week From Monday, Oct 18, 2021
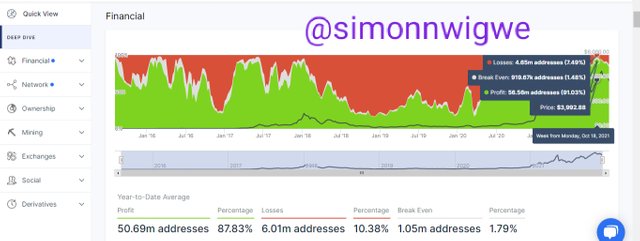
Price of ETH: $3,992.88
ITM: 56.56m addresses (91.03%)
OTM: 4.65m addresses (7.49%)
Week From Monday, DEC 13, 2021
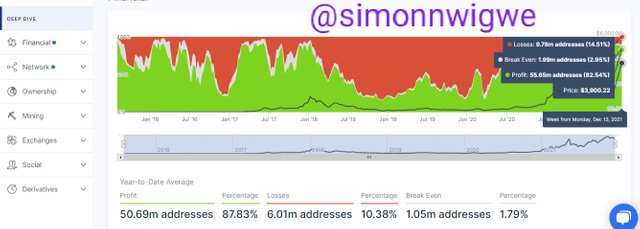
Price of ETH: $3,900.22
ITM: 55.65m addresses (82.54%)
OTM: 9.78m addresses (14.51%)
Based on my analysis above, the price of ETH as at October till December has shown a little drop as it moved from $3,992.88 in October to $3,900.22 in December. Similarly, when considering the ITM there is a drop in the number of ITM as it move from 91.03% to 82.54%. The case of the OTM is quite different as it has experience a raise over the few weeks. As at October it was seen at 7.49% but at December, it raise to 14.51%.

Conclusion

Global in/out of the money (GIOM) is indeed a very important part of the on-chain metrics. We have also learnt the three different categories of these GIOM which include the ITM, OTM and ATM. The GIOM as we have seen is a very useful tool when it comes to spotting support and resistance level. In all the GIOM if quite understood by traders will help them maximize profit in trading and minimize loss as they will be aware when exactly to trade.
We have also learnt about the large transaction volume and we did said that they are of two different types namely the total transaction volume and the adjusted transaction volume. We have learnt how these tool is also important as the keep track of large transaction from 100,000 and above.
My sincere appreciation goes to the professor in the person of
@sapwood for such a wonderful lecture. Sir I do hope to learn more from you as the Academy progress. Thanks once again for such an insightful lecture.

NB: All Screenshot are taken from app.intotheblock.com


Downvoting a post can decrease pending rewards and make it less visible. Common reasons:
Submit