My fellow crypto lovers, it's week 5 in the Steemit engagement challenge for season 19, and this week we also have yet another interesting topic that should be carefully looked out to enable us to become better traders in the world of cryptocurrency and other financial sectors using technical indicators which enables us to spot market reversals.
Background image Edited on Canvas
In today's engagement challenge, we are going to be looking out for spotting market reversals using the commodity Channel Index (CCI) indicator. I'm sure many of you have heard about this indicator and have even used it so it may not be new to you but I assure you that you have something new to learn if you read this publication till the end. Without further ado, let's get started.
| Define the Commodity Channel Index (CCI), and explain its role, calculation formula, components, main purpose, history, and interpretation of overbought and oversold values with real-world examples. |
|---|
The Commodity Channel Index (CCI), is one of the most used momentum-based indicators which is used by traders to spot trend reversal and also the strength of the trend which enables them to make decisions on the trade or market depending on the signal provided by the indicator.
The reversal in the crypto market is very important as it prepares traders for the next movement and this indicator helps to give traders this information it doesn't stop there, it also tells the trader how strong the reversal signal is so that they will be watchful to avoid fakout.
So from the explanation above you can see the role of this indicator in the financial market. For emphasis, the main role of the Commodity Channel Index (CCI) indicator is to help traders spot the position of market overbought, oversold, reversal, and possibly the strength of the movement of the asset at that point and time.
Calculation formula
The Commodity Channel Index (CCI) has a standard formula as seen in the image below 👇
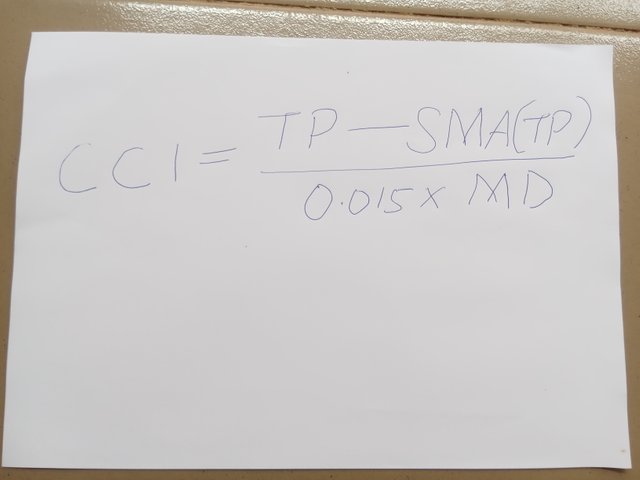
CCI = TP - SMA(TP) / 0.015 * MD
Where;
TP = Typical Price which is the sum of high, low, and close over a given period. The formula to get this can be seen below 👇
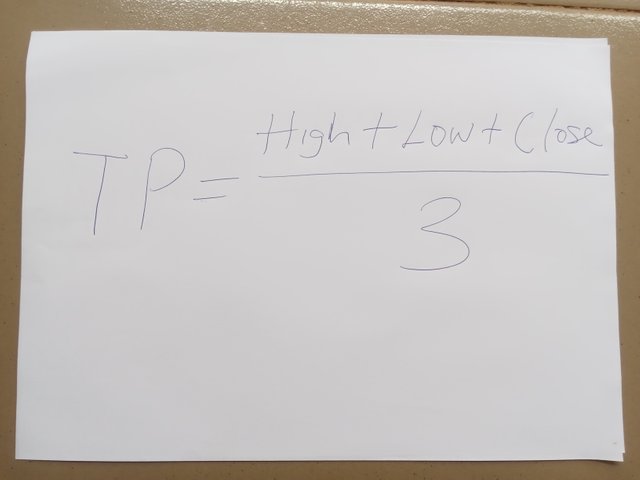
TP = High + Low + Close / 3
SMA(TP) = The simple moving average is the average of TP over a given period gives us the SMA(TP).
MD = Mean deviation is used to measure the deviation from TP to SMA and the formula to calculate it can be seen below
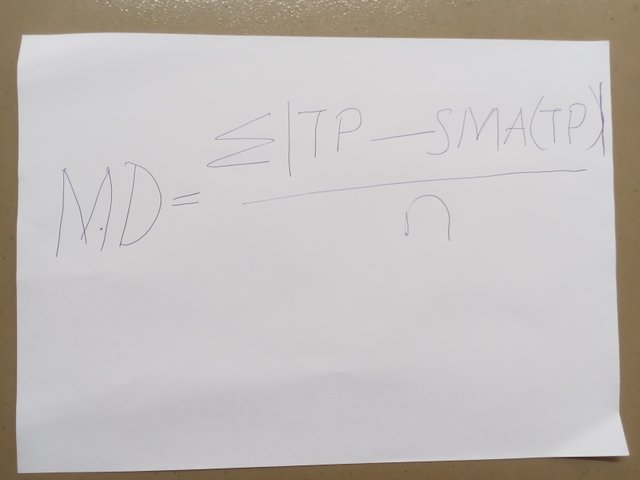
MD = £|TP - SMA(TP)| / n
Here n is the number of periods under consideration.
0.015 is a constant value used to ensure that values gotten from the CCI fall within -100 & +100
Therefore the main components in the calculation formula of the CCI indicator are TP, SMA(TP), MD, and a constant value which is ideally 0.015.
Main Purpose of the CCI indicator
As stated earlier, the main purpose of the CCI indicator is to spot trend reversal and also give traders the needed information to either prepare for an entry or exit position in case they have been on the trade or about to enter. So this indicator tells them the direction of the next trend movement and how strong the movement will be.
History of CCI indicator
The Commodity Channel Index (CCI), was introduced by Donald Lambert in the year October 1980. As the name suggests commodities, the indicator was originally designed to analyze different commodities but with the coming of other markets such as cryptocurrency, forex, and many others, the CCI was adopted to be used there as well since the movement of commodities and these assets are almost the same.
So since then, the CCI indicator is been used by traders and other financial analysts to help spot regions of overbought, oversold, and possibly reversal points when the elastic limits of the movement are exceeded.
Interpretation of overbought and oversold values with real-world examples.
There are two main points to be considered when using this indicator and that is the +100 for overbought and the -100 for oversold points.
So when the asset moves above the +100 CCI level, it indicates that the market has been overbought and it implies that possible reversal will take place any moment hence traders will look for possible reversal opportunities (bearish signal) to sell or short the market immediately the reversal happens.
Similarly, when the asset moves below the -100 CCI level, it indicates that the market has been oversold and it implies that a possible reversal will take place at any moment hence traders will look for possible reversal opportunities (bullish signal) to buy or long the market immediately the reversal happens.
In summary, in the real world, when an asset moves above +100 CCI it means the asset has been overbought hence a possible reversal is expected, traders are to wait for reversal and confirmation to enter and short the market. In the same way, when an asset moves below -100 CCI it means the asset has been oversold hence a possible reversal is expected, traders are to wait for reversal and confirmation to enter and long the market
| Explain overbought and oversold levels, CCI buy and sell signals. Show historical charts demonstrating the use of CCI to spot reversals, and discuss potential limitations of CCI and methods to mitigate them. |
|---|
Levels of overbought and oversold are an important factor that makes the CCI indicator stand out among others. So below I will like to explain in detail the overbought and the oversold levels of the CCI indicator.
Overbought Level: If the CCI indicator moves above the +100 level, it signifies an overbought for the asset under consideration which means that the price of the asset has moved above its average price and this tells the traders that a possible trend reversal is about to take place.
So what traders do at this point is to check for additional signal confirmation such as a trend reversal signal (Bearish reversal) which serves as confirmation of the signal provided by the CCI. When this signal is confirmed, then a decision to sell the market comes into play.
Oversold Level: If the CCI indicator moves below the -100 level, it signifies an oversold for the asset under consideration which means that the price of the asset has moved below its average price and this tells the traders that a possible trend reversal is about to take place.
So what traders do at this point is to check for additional signal confirmation such as a trend reversal signal (Bullish reversal) which serves as confirmation of the signal provided by the CCI. When this signal is confirmed, then a decision to buy the market comes into play.
CCI buy and sell signals
When using the CCI indicator, the basic signal one should look out for when buying or selling an asset is as follows.
Buy Signal
When the CCI is seen moving from below -100 to above -100 it means that the trend is changing and a possible upward movement is possible so you use other indicators for confirmation such as the volume indicator.
What happens here in the volume indicator is that you will see it increasing showing that the price is going up. When the volume indicator shows that you are looking for a possible buying position.
Divergence is also another important signal to look out for. When the price movement differs from the CCI movement we know that there is a potential trend reversal.
Sell Signal
When the CCI is seen moving from above +100 to below +100 it means that the trend is changing and a possible downward movement is possible so you use other indicators for confirmation such as the volume indicator.
What happens here in the volume indicator is that you will see it decreasing showing that the price is going down. When the volume indicator shows that you are looking for a possible selling position.
Divergence is also another important signal to look out for. When the price movement differs from the CCI movement we know that there is a potential trend reversal.
Show historical charts demonstrating the use of CCI to spot reversals
Here in this part will be discussing on reversal of bullish and bearish trend movements. So we are going to be looking at two charts here for a better understanding.
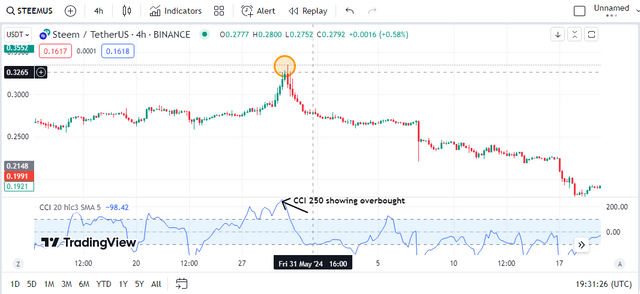
CCI bullish reversal: From the below chart, we have considered the pair of STEEMUSDT on a 4H timeframe. There was an upward movement in the price of the asset until it got to its peak which in this case was $0.3265 the CCI also is seen at 250 which is an overbought region.
From the chart, every reasonable trader will expect a trend reversal after seeing the peak attended by the market. This is shown from the chart and the indicator as the indicator is seen above 100 which is for average movement.
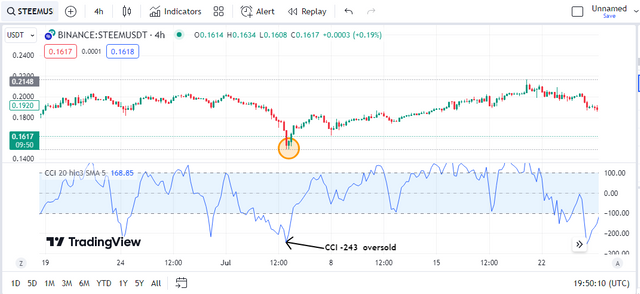
CCI bearish reversal: From the below chart, we have considered the pair of STEEMUSDT on a 4H timeframe. There was a downward movement in the price of the asset until it got to its trough which in this case was $0.1488 the CCI also is seen at -243 which is an oversold region.
From the chart, every reasonable trader will expect a trend reversal after seeing the trough attended by the market. This is shown from the chart and the indicator as the indicator is seen below -100 which is for average movement.
Potential limitations of CCI
Some of the major limitations of the CCI indicators can be seen below.
Prices of assets can remain in the overbought or oversold region for a long time and that leads to fake signals for traders who want to enter the trade immediately after it reaches overbought or oversold and this is called false signal.
Since the CCI is a lagging indicator, most times the market may have a sharp move that will not be captured by the indicator making traders lose their chances of earning from the market.
Absent of clear signal during a sideways movement. Since the sideways market always shows buy and sell traders may lose their funds if they try to trade in such a market.
Methods to mitigate them
There are lots of methods to mitigate the limitations stated above and a few ways to do that include the following.
Use the CCI indicator in combination to other indicators to help filter false signal and also to help you solve the lagging nature of the indicator.
You may want to also consider using different timeframe such as lower and higher timeframe to know which best suit your trading strategies. For the lower timeframe, you can get a lot of signal whereas for the higher timeframe noise will reduce so chose which suits your trading strategies.
| Discuss the advantages and disadvantages of CCI, its use with other indicators, the risks of false signals, and the impact of cryptocurrency volatility on the effectiveness of CCI. |
|---|
Here in this part, we will look at the advantages and disadvantages of the CCI separately. So let's go ahead to look at them one after the other starting with the advantages.
Advantages of CCI
Mainly used to identify overbought and oversold regions in the market. This helps to tell the traders about the price reversal points in the market.
The indicator serves many purposes as you know it was initially designed for commodity use but today it works for crypto, forex, and even the stock exchange.
Divergence dictation is easier using this indicator as you can see clearly when the market is going in a different direction and the indicator is going in a different direction.
Disadvantages of CCI
CCI is a lagging indicator so most times traders that use it miss out on opportunities. This means that when they are supposed to enter the market the indicator may not tell them and that opportunity may pass them by.
CCI also provides false signals to traders. When a market has an extended overbought or oversold traders may want to go opposite direction in the market because their trade has reached its overbought or oversold region.
Sideways market using the CCI indicator will generate many buy and sell signals at the same time so here you won't be able to trade because you may go long and then see the market going short immediately.
Using CCI with Other Indicators
To tackle false signals and also confirm the signal produced by the CCI indicator, it is important to combine the CCI indicator with other indicators. In my case, I like combining the indicator with MA, RSI, or the volume indicator.
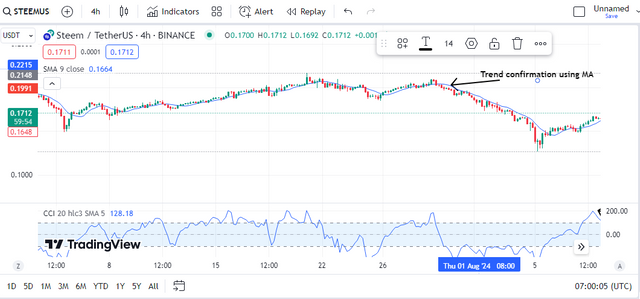
- CCI & MA: When you combine the moving average with the CCI indicator, the moving average will help you as a trader to confirm the trend of the market which will help you to make more informed decisions as to the direction of the market you must take. So if both indicators don't agree with each other you have to watch the market carefully.
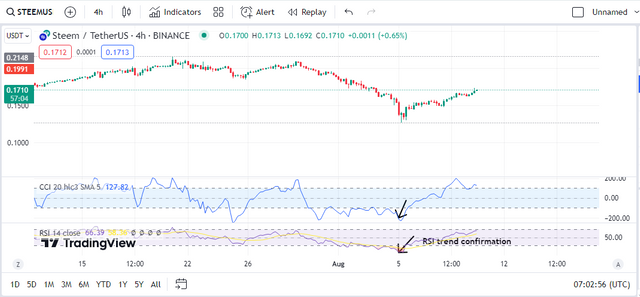
- CCI & RSI: Since the Relative Strength Index indicator also provides signals for overbought and oversold, using it with the CCI will help provide a stronger signal confirmation which will confirm to the traders the next move of the asset.
- CCI & Volume Indicators: Using the volume indicator with the CCI indicator will enable traders to know the strength of the trend. If the price is increasing and the volume is increasing it means the momentum of the trade is high, if the price is increasing and the volume is decreasing it means the momentum is low.
Risks of False Signals
When the market is volatile, especially when using a smaller time frame the CCI indicator will always bring a false signal as it may be showing buy whereas the market is suggesting sell this is what we call noise.
There are times we may be expecting a trend reversal in the market but we can't see it as the market may remain at its overbought or oversold region for a longer time.
Sideways market, the signal produced may not correspond with market movement and that will lead to many losses in the market if the traders remain in the market.
Impact of cryptocurrency volatility on the effectiveness of CCI
Cryptocurrency is very volatile and because of its high volatility it has some impact on the effectiveness of CCI below are a few of the impacts I would like us to look at.
Since the cryptocurrencies are highly volatile, this can help provide overbought and oversold signals to the CCI indicator giving traders more opportunities to buy and sell the market.
The high volatility also can cause the indicator to bring forth a false signal. As you know the indicator is lagging hence the trend may have been completed before the signal may be given by the indicator.
Sharp change in trend is also another problem here. When the market rapidly changes then the indicator may not change with it and that makes traders lose their money or miss out on opportunities to go the other side.
| Choose a recent Steem/USDT chart, use CCI to analyze and identify reversal points, annotate the chart, and explain the method used. Discuss the validity and usefulness of these reversals for trading. |
|---|
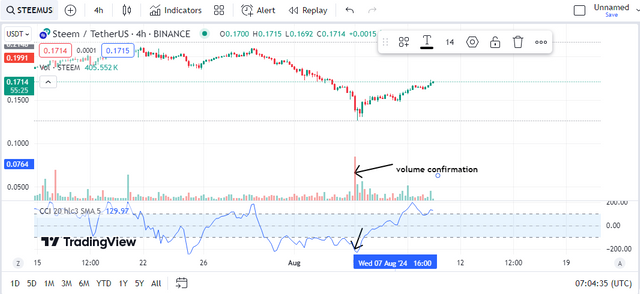
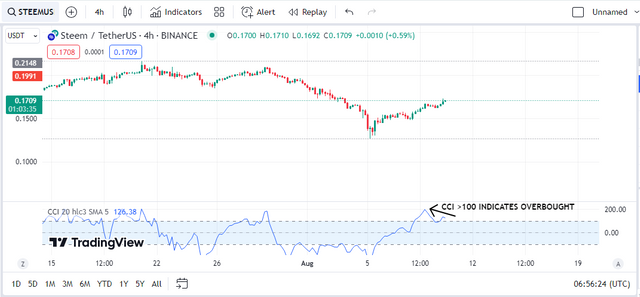
The chart below is a recent STEEMUSDT chart and as you know from the CCI rules, a reversal is always expected when the price is above +100 or below -100. Based on our chart today, as seen below we will be looking at a reversal to the downward direction as the market is currently in its overbought region.
The chart above shows that the market is overbought as the CCI is seen above the +100 CCI level i.e., CCI > 100 this implies that we are expecting a reversal any moment. The CCI at the moment is at +200 which shows a very strong upward movement has occurred and the possibility of reversal is very high I couldn't decide because sometimes the overbought is extended and the same goes for the oversold.
So I decided to wait patiently for a confirmation from the market. The confirmation I'm expecting to see is either a bearish candle formation and also if the 4H candle closed bearish or not since I'm working with the higher timeframe to avoid noise in the market.
Explain the method used
The method used is simple since I understand the levels of overbought and oversold and the current market is in its overbought region what I looked out for is the reversal of the asset so that I can short the market. To do this I waited for the reversal and a confirmation of the reversal so as not to be trapped in the market.
When I was clear with the directions using the confirmation I got from the price chart, I entered the market. So the method is nothing new just the usual principle but always wait for confirmation.
Discuss the validity and usefulness of these reversals for trading
Using the CCI indicator you can easily spot levels where the market has been overbought or oversold and when these regions are spotted the next thing to do is to wait and confirm the trend reversal. Ideally, the indicator teaches that when the market is overbought or oversold the next thing is the reversal to the opposite direction.
Though a false signal may be generated due to volatility of the cryptocurrency market while using the CCI indicator and that will lead to loss of money hence it is recommended that you make use of the CCI indicator with other indicators such as MA, RSI, or even the volume indicator as I have explained above.
| Describe a CCI-based trading strategy, explain the buying and selling rules, provide historical or simulated examples showing the strategy's effectiveness, and discuss potential modifications to improve its performance. |
|---|
CCI indicator is a technical indicator that we use to analyze the market to help us know when the enter and when to exit the market. These can be seen in the overbought and the oversold region of the market as it is the period where the trend reverses.
With CCI, traders are expected to know when to enter the market and when they should exit the market. From the rule if CCI > +100, it means the asset is overbought and the next thing that comes to mind is that the market may reverse. Similarly, if the CCI < -100, it means the asset is oversold and also possible reversal is expected.
Explain the buying and selling rules
For buying the following rules must be taken into consideration at all times.
Be sure that the price of an asset is above -100 which means the asset is going upward.
Wait for confirmation from the bullish candles or use other indicators to confirm the movement.
You must place a stop loss below the last move or closure of the last candle before the one you are using as an entry.
Take profit when the price moves above the +100 level which is a region of overbought.
For selling the following rules must be taken into consideration at all times.
Be sure that the price of an asset is below +100 which means the asset is going downward.
Wait for confirmation from the bearish candles or use other indicators to confirm the movement.
You must place a stop loss above the last move or closure of the last candle before the one you are using as an entry.
Take profit when the price moves below the -100 level which is a region of oversold.
Provide historical or simulated examples showing the strategy's effectiveness
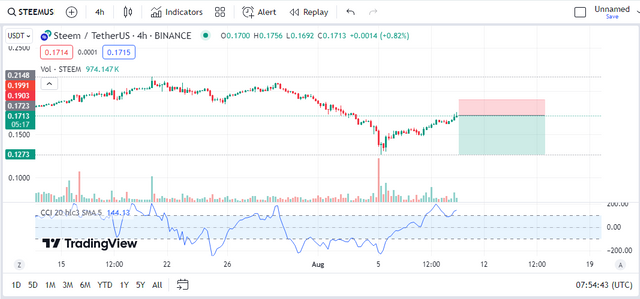
Let's consider the chart below as an example. Here in this chart, I'm combining the CCI and the volume indicator to carry out my trade to check the effectiveness of these strategies. I'm also using a demo trade to test it.
Seeing that the CCI is going below the +100 level and seeing that the volume is not strong enough I went to a lower timeframe of 1H and confirmed and I discovered that the market is already moving downward. Seeing that the last bullish candle in the 4H is also dropping I decided to enter the market.
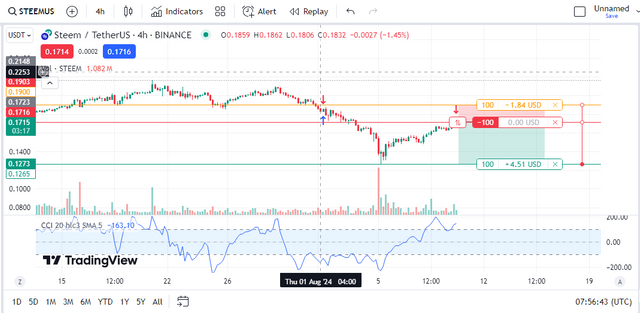
The chart above shows the sell logo I added to the chart and it also indicates my levels of stop loss and my take profit level as calculated by the CCI indicator.
To also keep my mind on the trade I decided to demo trade the asset. So what I did was activate the demo trade which as you can see shows that if the market goes against me I will be making a loss of $1.84 and if the market goes in my favour I will make a profit of $4.51 which is like a trade of 1:2 risk reward ratio.
Also from the trade order below you can see the details of the trade running and I will continue monitoring it to see how far the market goes.
Discuss potential modifications to improve its performance.
To improve the performance of these strategies, all one needs to do is firstly use other indicators in combination with the CCI to help him or her filter out noise and false signals that may cause him or her to lose money during trading.
Use a timeframe that is most suitable for your trading and understand how that timeframe works with the CCI indicator. If you are good with using a higher timeframe, then study how the CCI uses this timeframe and improve your strategies from there the same goes with the smaller timeframe.
CCI period as well as risk management must also be taken into consideration. Use a period that best suits your trading strategies and also ensure to always use good risk management to minimize losses and maximize profits.
Finally, I want to invite @suboohi, @patjewell, and @ripon0630 to also join the contest and share with us their thoughts of Spotting Market Reversals with CCI.
NOTE: Unless otherwise stated, All images are mine taken from TradingView website and snapshot with my phone.


Thank you, friend!


I'm @steem.history, who is steem witness.
Thank you for witnessvoting for me.
please click it!
(Go to https://steemit.com/~witnesses and type fbslo at the bottom of the page)
The weight is reduced because of the lack of Voting Power. If you vote for me as a witness, you can get my little vote.
Downvoting a post can decrease pending rewards and make it less visible. Common reasons:
Submit
Upvoted. Thank You for sending some of your rewards to @null. It will make Steem stronger.
Downvoting a post can decrease pending rewards and make it less visible. Common reasons:
Submit
Downvoting a post can decrease pending rewards and make it less visible. Common reasons:
Submit
This is an excellent and thorough explanation of the Commodity Channel Index (CCI). You've done a great job breaking down its purpose calculation and how it can be used to spot market reversals. I especially appreciate the clear examples and charts that help in understanding how CCI works in real-world trading. Your insights on the limitations and methods to mitigate them are also very helpful for traders looking to refine their strategies. Good luck with the contest
Downvoting a post can decrease pending rewards and make it less visible. Common reasons:
Submit
Is this comment for this post or another?
Downvoting a post can decrease pending rewards and make it less visible. Common reasons:
Submit
sorry i eidt my comment it post by mistke
Downvoting a post can decrease pending rewards and make it less visible. Common reasons:
Submit
Excellent and thorough explanation the Commodity Channel Index (CCI) is a technical tool that helps gauge the buying and selling signals in securities. The CCI indicates the difference between a security's price and its average over a given period, usually 14 days. The oscillator swings around a zero line- any value of the indicator above +100 signifies an oversold market condition and values below -100 signify that asset sustaining strength overbought conditions. best of luck with the contest my friend.
Downvoting a post can decrease pending rewards and make it less visible. Common reasons:
Submit
Thanks for your wonderful comments my friend. It seems you missed it up here in your statement
I think you meant that above +100 signifies overbought and below -100 signifies oversold.
Downvoting a post can decrease pending rewards and make it less visible. Common reasons:
Submit
Hello sir.
It's always an honor reading from your post.
Your definition of CCI and it use are right on point...
You have demonstrated with ease the condition on which CCI is applied in the trading market and was able to come out with a detailed formula for calculating CCI.
You made a great review on historical charts on applying CCI to real life. Showing clearly it's approval and effectiveness if applied in real life.
Thanks for sharing with us and I'm happy to have you participate in the contest.
Good luck in. Your entry
Downvoting a post can decrease pending rewards and make it less visible. Common reasons:
Submit
It's great to see that you like reading through my post. These kind words will make me work even harder. Thanks for your wishes dear friend.
Downvoting a post can decrease pending rewards and make it less visible. Common reasons:
Submit
You explained the topic very clear. The content is really add value to trading environment. The way you explaind each topic can helpful for the traders to improve their trading stratergies. Readers of this post can assist them on how to trade properlly with CCI. I also really like the presentation of this post which help to understand this topic more clear.
Downvoting a post can decrease pending rewards and make it less visible. Common reasons:
Submit
Thanks, dear friend for your valuable comments it's much appreciated.
Downvoting a post can decrease pending rewards and make it less visible. Common reasons:
Submit
You have an outstanding article, you expressed your in-depth knowledge in the great theme, you shared that the overbought zones are usually above the positive 100 marks and whenever the trader is about to perform trading activity at the point, the trader looks our for a double confirmation of a bearish signal and also during the exhaustion point at the oversold region, traders must definitely be at the look out for a bullish signal to perform trading activities. I wish you success in the challenge my dear friend.
Downvoting a post can decrease pending rewards and make it less visible. Common reasons:
Submit