

Fellow steemians
Hope you guys had a lovely day, am so delihted to be here with you guys once again. Every opportunity I have in the academy is to learn and increase my knowledge in the crypto currency world. Today I have attended a lecture delivered by our noble professor in the person of
@fredquantum where he explained extensively on the topic Trading Crypto with Aroon Indicator, after attending the lecture, I have resolve to carry out the assignment task given by the professor. Let's get started.
1. What is Aroon Indicator in your own words? What are Aroon-Up and Aroon-Down? (Show them on Chart).
The Aroon indicator is an indicator developed by Tushar Chande in the year 1995. This indicator is a trend based indicator as it is use mainly to measure trend movement in trade. When we want to identify the trend in a given trade, the indicator that is suitable for that is the Aroon indicator. This indicator is made up of two lines I.e the Aroon-up and the Aroon-down.
The Aroon indicator lines is usually moving in the range of 0 to 100. Now when the indicator is approaching the value 100 it implies that the trend is a high trend and more also if the indicator value is approaching 0 it means that the trend is low trend. When the indicator moves close to 100 we say it is Aroon-up I.e uptrend or bullish trend. When the indicator moves close to 0 we say it is Aroon-down I.e downtrend or bearish trend.
The Aroon indicator has proven to be one of the best trend identifying indicator that works almost very perfectly with it been combined with other technical indicator. The indicator is very easy to understand because of the present of the two lines it is having. So when ever there is a cross in the both lines of the indicator we can presume that it is all about trend reversal.
What are Aroon-Up and Aroon-Down?
Aroon-Up and Aroon-Down are two lines that are contained in the Aroon indicator. Usually, they are green and red in colour. The Aroon-up is greenish in colour whereas the Aroon down is reddish in colour. Aroon up is use to identify bullish trend movement whereas the Aroon down is use to identify bearish trend movement.
Aroon-up Indicator Line
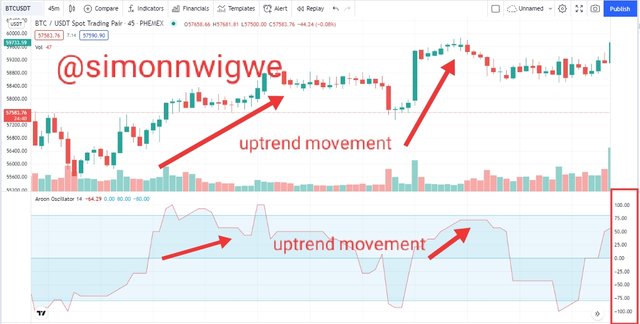
Just as we have explained above, the Aroon up line is green in colour and it is use to identify the bullish trend movement. When price moves close to the value 100 we say that the market is in a very strong bullish trend I.e the price of the asset will be going upward. Consider the chart below.
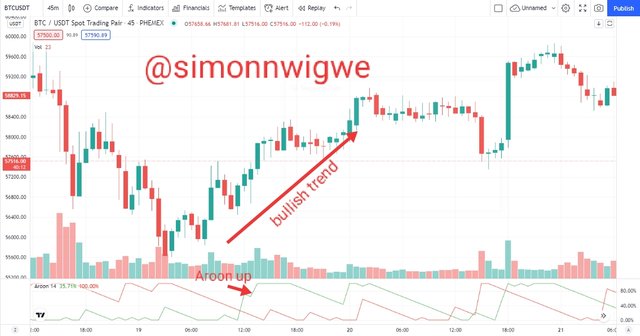
From the chart above, for the uptrend to take place, there was a cross between the Aroon up and Aroon down line I.e Aroon up crossed over Aroon down and that made the movement from bearish trend to bullish trend.
Aroon-down Indicator Line
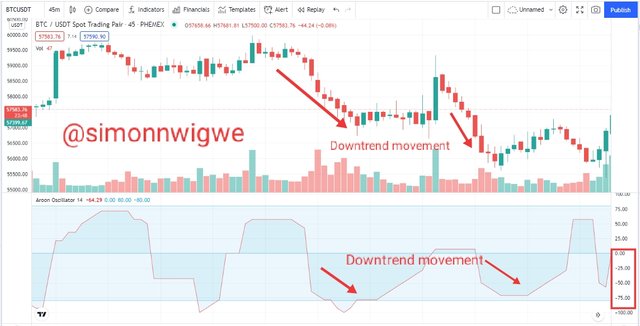
Just as we have explained above, the Aroon down line is reddish in colour and it is use to identify the bearish trend movement. When price moves close to the value 0 we say that the market is in a very strong bearish trend I.e the price of the asset will be going downward. Consider the chart below.
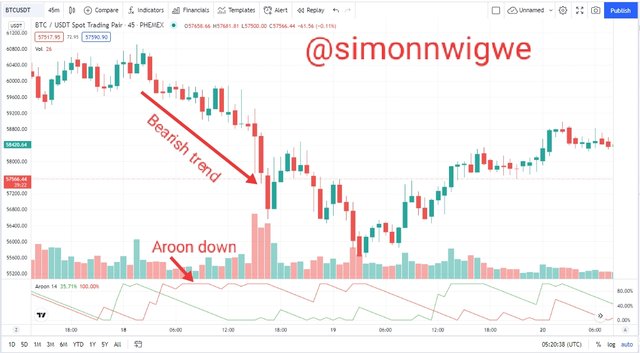
From the chart above, for the downtrend to take place, there was a cross between the Aroon down and Aroon up line I.e Aroon down crossed over Aroon up and that made the movement changed from bullish trend to bearish trend.
2. How is Aroon-Up/Aroon-Down calculated? (Give an illustrative example).
The Aroon up and Aroon down indicator can be calculated using the function below.
Aroon-up = [(n - Periods since the recent 25 period high) / n] * 100
Where n = period used
Example: If the Aroon up period is 25 and the period since the highest high within period of 14.
Using the above relation, we will have
Aroon-up = [(25 - 14) / 25] * 100
Aroon-up = ( 11 / 25 ) * 100
Aroon-up = 0.44 * 100
Aroon-up = 44
Aroon-down = [(n - Periods since the recent 25 period low) / n] * 100
Where n = period used
Example: If the Aroon down period is 25 and the period since the lowest low within period of 8.
Using the above relation, we will have
Aroon-down = [(25 - 8) / 25] * 100
Aroon-down = ( 17 / 25 ) * 100
Aroon-down = 0.68 * 100
Aroon-down = 68
From the two calculations above, we can see Aroon-up at 44 and Aroon-down at 68 implying that the Aroon-down line is above the Aroon-up line indicating the fact the the current trend is a bearish trend.
3. Show the Steps involved in the Setting Up Aroon indicator on the chart and show different settings. (Screenshots required).
The process of setting up the Aroon indicator is similar like other indicator setup. Just visit tradingview.com or any platform you are using for your trade. Then select your pair of trade.
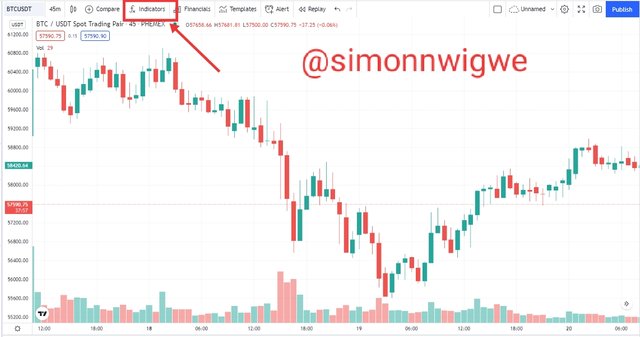
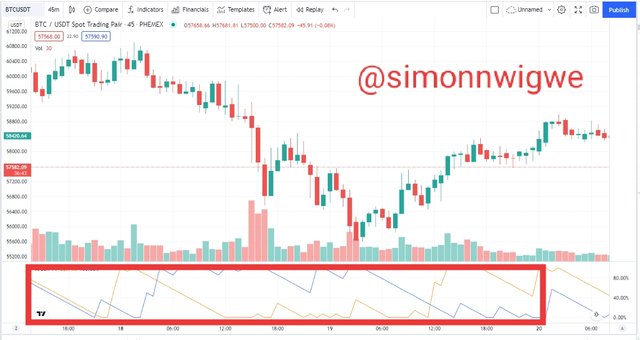
- First click on the fx function or indicator function as seen in the screenshot below
- Search for Aroon and click on it
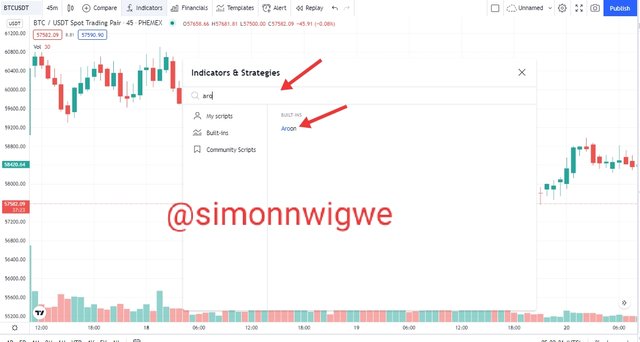
- The indicator has shown on the chart as seen below.
Setting in the Aroon Indicator
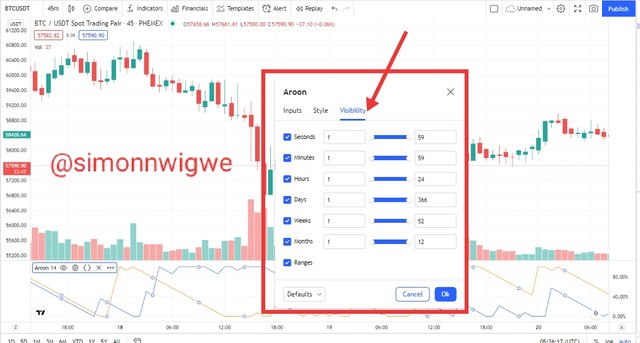
- Click on settings as seen in the chart below
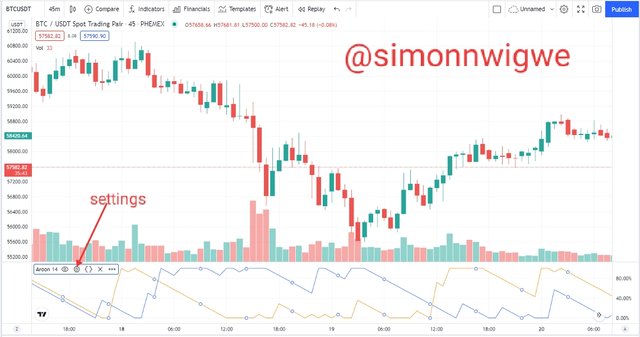
- Pop-up menu will appear as seen in the screenshot below
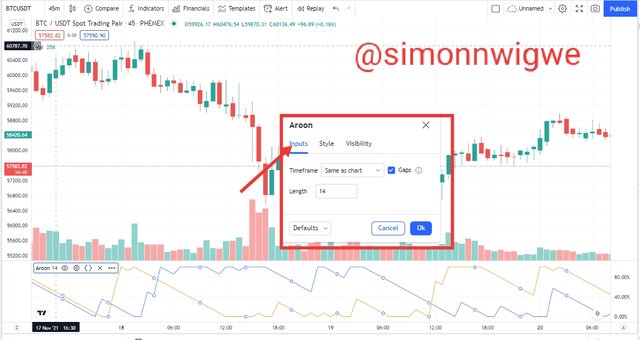
Here presents you with timeframe and period and you can adjust it to your own favour.
Here presents you with colours of Aroon up and Aroon down and you can adjust it to any colour of your choice.
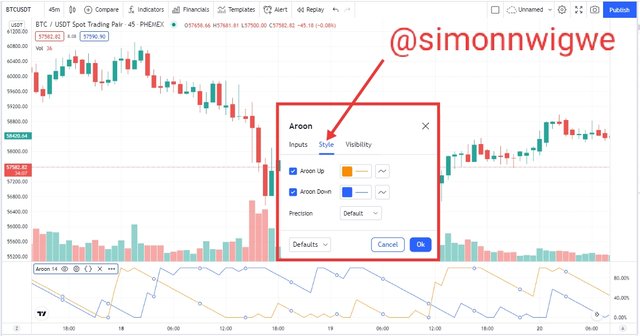
Here present you with with adjustment of the parameters present in the chart.
4. What is your understanding of the Aroon Oscillator? How does it work? (Show it on the chart, kindly skip the steps involved in adding it).
The Aroon Oscilator is also a trend indicator that is range between -100 to 100 and it has a center point of 0. This Aroon oscillator as I said earlier is a trend based indicator which tells us the current trend, possible change in the trend if there will be any and to add to it, it also measure the momentum of the current trend.
The Aroon oscillator as we have said has range of values between -100 to 100. In the case of uptrend or bullish trend, you will the oscillator moving close to 100 whereas in the case of downtrend or bearish trend you will the oscillator moving close to -100
Aroon Oscillator Bullish trend
Here, the Aroon Oscillator lines has moved above the center point which is 0 hence it is in an uptrend movement or bullish movement.
Aroon Oscillator Bearish trend
Here, the Aroon Oscillator lines has moved below the center point which is 0 hence it is in a downtrend movement or bearish movement.
5. Consider an Aroon Indicator with a single oscillating line, what does the measurement of the trend at +50 and -50 signify?
From the explanation made above about the Aroon Oscilator, you will agree with me that the range we have is between -100 to 100 with 0 as the center of it. And from that we explain that once the indicator moves below 0, it is implying a downtrend movement and above 0 is implying an uptrend movement. In the same way, if an Aroon indicator is having a single line, the trend at +50 will signify that the trend is a bullish trend and the trend at -50 will signify a bearish trend. Recall that +50 is above the value 0 and the number or value -50 is below the 0 value. So from that we can conclude that +50 is an uptrend and -50 is a downtrend.
6. Explain Aroon Indicator movement in Range Markets. (Screenshot required).
When we talk about range movement in any indicator, we are referring to the sideways movement of the price of an asset without any definite trend. Here in the Aroon indicator, we see this movement when there is no crossover between the both lines. Let's consider the screenshot below.
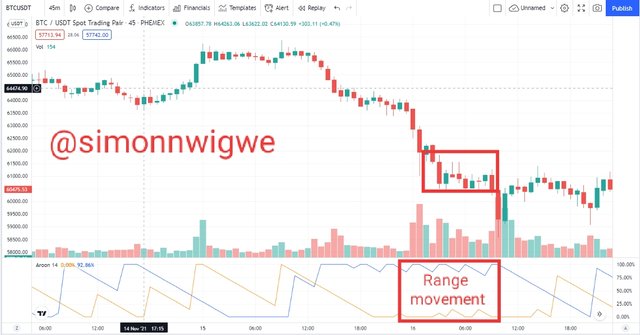
In the above screenshot, we can see the both Aroon line having a zig-zag movement without them crissing each other. Here the market is in a range and not in trending hence it is always difficult to make any form of trade at this point. We don't exactly know the direction of the trade at this point.
7. Does Aroon Indicator give False and Late signals? Explain. Show false and late signals of the Aroon Indicator on the chart. Combine an indicator (other than RSI) with the Aroon indicator to filter late and false signals. (Screenshots required).
Yes the Aroon indicator gives a false and late signal. As we know before this time, no indicator is 100% perfect and because of that it is never advisable to use the indicator as a stand alone tool. So the only way to do away with all these false and late signal is by combining it with other indicators as well.
False Signal
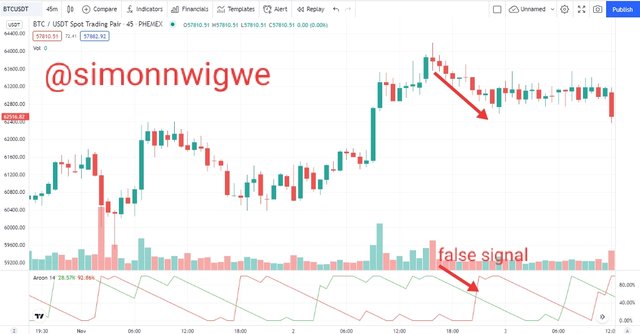
The screenshot above shows a false signal as the indicator reads that the trend is bullish form whereas the price if the asset it self is saying that the asset at that point is bearish. Now this may lead most traders in to purchasing of asset and they may end up losing money at that point.
Late Signal
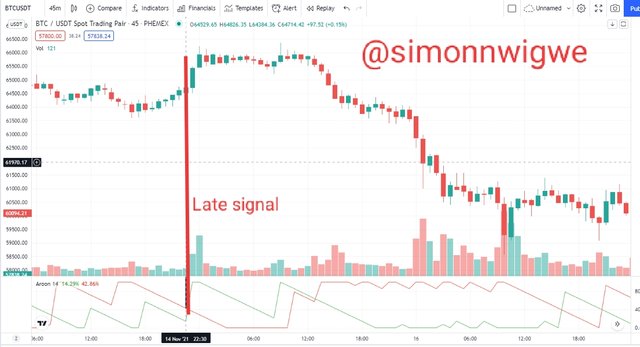
The screenshot above shows a late signal as the indicator reads that the trend is still bullish whereas the the price has left bullish to bearish and the indicator spend a little time before it changed to work towards the direction of the price. In this type of situation, traders miss out some opportunity which they could have utilise earlier.
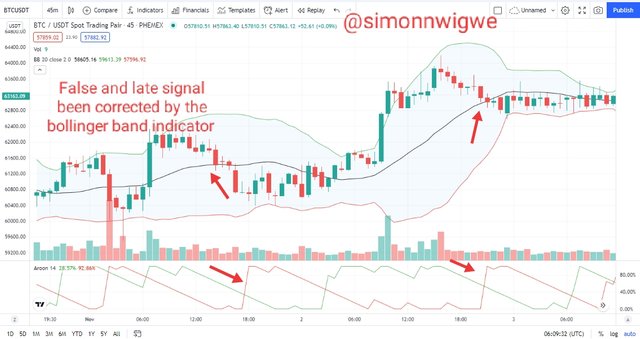
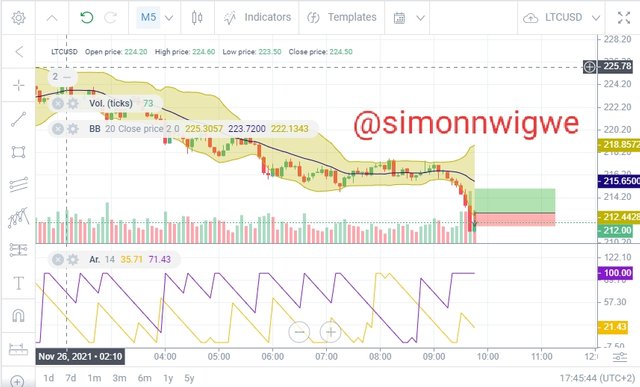
To filter this signal, I combined the Aroon indicator along side Bollinger band indicator and the regions for late and false signal was spotted as seen in the screenshot below. The indicator spotted the earlier entry for sell and buy.
8. Place at least one buy and sell trade using the Aroon Indicator with the help of the indicator combined in (7) above. Use a demo account with proper trade management. (Screenshots required).
With the help of the indicator I combine in question 7 above I placed a trade for both but and sell using my demo account. Here are the screenshot of the trade. My stop loss and take profit ration are taken as 1:1 to minimize lost.
Sell Trade
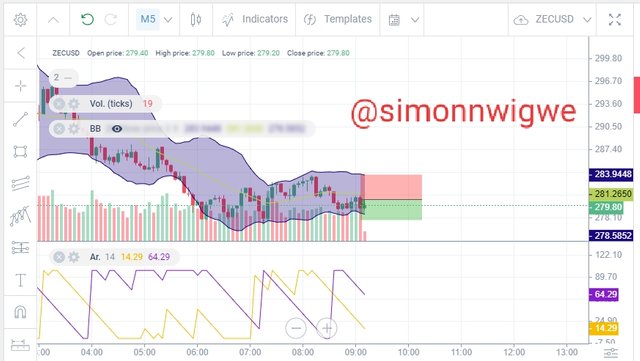
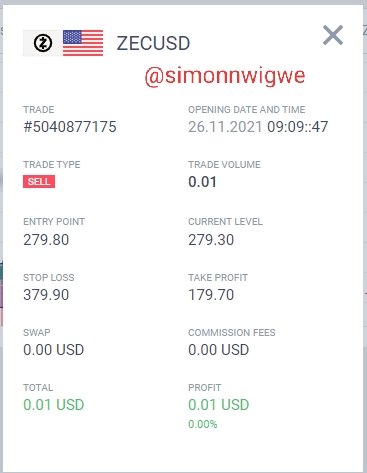
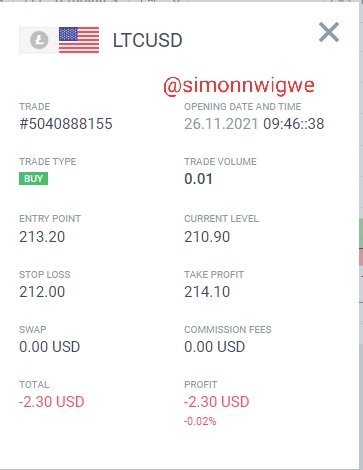
Buy Trade
9. State the Merits and Demerits of Aroon Indicator.
The merits and demerits of Aroon indicator can be seen in the table below.
| S/No. | Merit of Aroon | Demerit of Aroon |
|---|
| 01. | Easy to identify entry and exit point | Due to lagging of the indicator this signals come late |
| 02. | A crossover always implies trend reversal and hence it is easy to note | Trading in range can be very risky using this indicator |
| 03. | Current trend can be is easily seen and spotted | Has serious issues with false and late signal generation |
Conclusion
Aroon indicator as we have seen is a trend based indicator that is made up of two different lines I.e the Aroon up and the Aroon down. They crossing of these lines implies a trend reversal. We have also looked at the Aroon oscillator which is made up of one line and has a range between -100 to 100 with 0 as it center. If the Aroon moves above 0 we say it is uptrend and when the Aroon moves below 0 we say it is downtrend.
Finally, I want to sincerely appreciate the steemitblog for such wonderful opportunity to learn via this amazing platform and also am appreciating the incumbent professor in the person of
@fredquantum for such an educative lecture.