

Hello guys
It's yet another week in the steemit crypto academy. Today I attended the lecture delivered by professor
@fredquantum on the topic
Trading Crypto with Keltner Channels. This blog is a responses to the homework given by the professor at the end of his lecture. Let's get started.

1. Creatively discuss Keltner Channels in your own words.

Crypto currency trading is highly volatile in nature and for that reason, we need a volatile form of indicators to spot the trade movement. The Keltner Channels is one of these volatile indicators and these indicator helps traders to ascertain the level of volatility of the trend and the momentum of the trend as well. It is important to mention here that the keltner channel indicator make use of 3 different line I.e the upper line (upper band), the middle line (EMA line) and the lower line (lower band)
The said indicator came into existence in the year 1960s as it was developed by Chester Keltner. As time goes on, some lapses where dictated in the indicator and in the year 1980s the same indicator was reviewed by Linda Raschke. This work carried out on the indicator help to solve the lapses found on the indicator.
The keltner channel indicator is used for so many purposes by many traders. They usage include trend dictation as I have earlier mentioned, breakout dictation, support and resistance level spotting just tome tion but a few. The keltner indicator as we have mentioned earlier is a volatility indicator I.e it is use to measure price volatility which is done by the upper band and the lower band and this upper and lower band are two times the average true range (ATR) which is seen above and below the EMA line. Recall that we mentioned earlier that the EMA is found with these two line I.e the upper and lower band.
The channel in the indicator is use to make trading decision, this implies that the trend direction can be identified from the channel and if there is a reversal in trend, the it will signify it by making a move outside the channel.

2. Setup Keltner Channels on a Crypto chart using any preferred charting platform. Explain its settings. (Screenshots required).

The Keltner channel indicator can be set up from any trading platform that uses the Keltner channel. For the studies, we will be making use of the tradingview.com site to set up our keltner indicator. Let's get started.
- visit the tradingview.com website and on the landing page select chart.
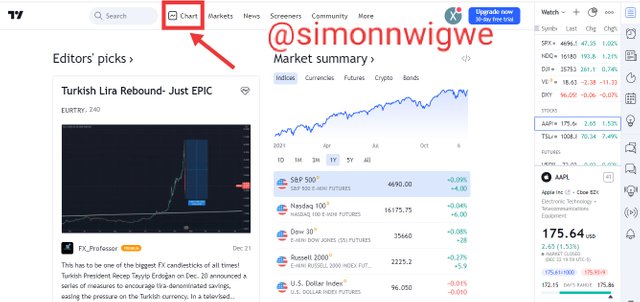
- Once the page has successfully load, select any pair of trade of your choice. Then click on the fx indicator menu as seen below.
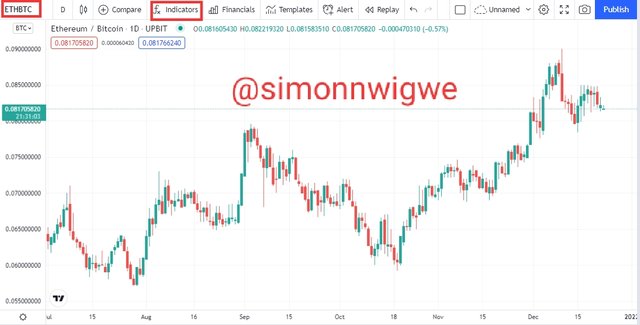
- On the search menu bar, type keltner and then click on the keltner channels indicator as seen below.
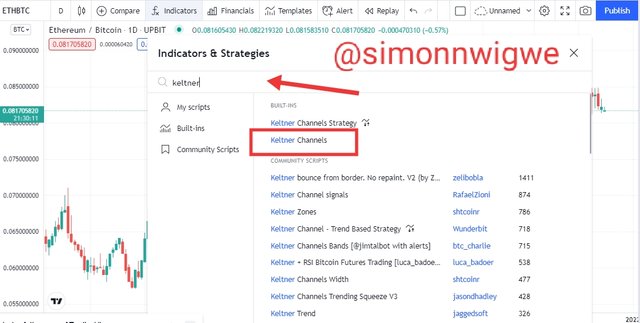
- Immediatly after that you will see you indicator added to the chart as we can see in the screenshot below.
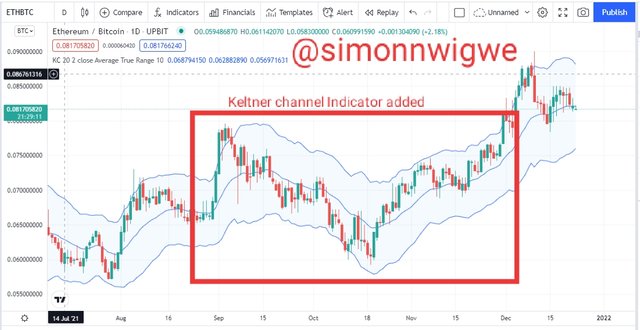
Configuring the Keltner Indicator
To configure the keltner indicator, one has to click on the settings icon
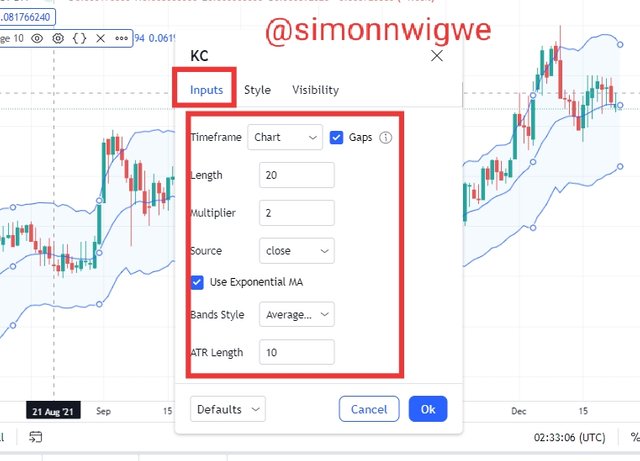
Once that is clicked a pop up menu will display with the headings Inputs, Style and Visibility. See screenshot below.

Inputs Tab:- The inputs tab has the following information contained in it, Timeframe: Chart, length: 20, Multiplier: 2, ATR length: 10 etc. These settings in the Tab menu are default settings of the indicator but if the trader has a better understanding of the trade or indicator, he or she can alter the settings. See screenshot of the Tab menu below.
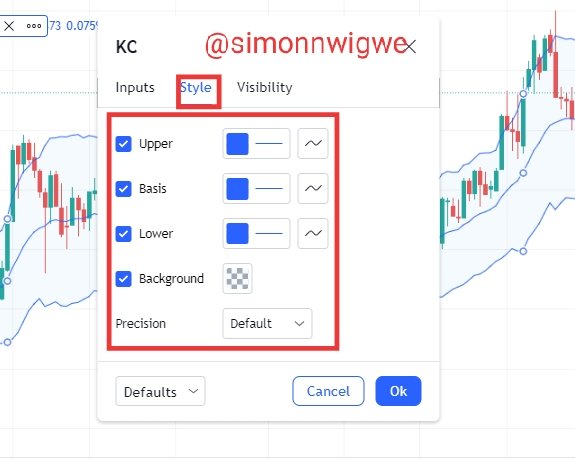
Style Tab:- The style has to do with the curve colour of the lines present in the indicator. It also has to do with thickness of the line curve. The information contain here include the upper, basis and lower. The colours can be change.
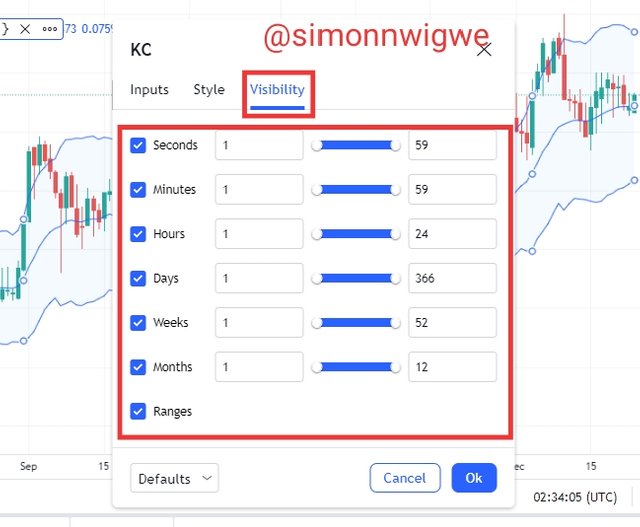
Visibility Tab:- Here you can adjust the visibility of the indicator. You can increase or reduce the visibility of the lines present on the chart.

3. How are Keltner Channels calculated? Give an illustrative example.

In other to properly calculate the keltner channels indicator, one has to take into consideration the following parameters. The EMA, the multiplier and the ATR. From the default settings we have seen that the value of the multiplier is 2 and the ATR length is 10.
To calculate your
Upper band = EMA + 2 * ATR
Lower band = EMA - 2 * ATR
In the case of the value of the EMA, it depends on the value of the period selected for the calculations.
Let's consider the example below.
A pair of BTC/USD has the following readings
EMA period = 20
ATR length = 10
Multiplier = 2
Calculate the keltner indicator using the data given above.
EMA = Middle line = 20
Upper band = EMA + 2 * ATR
Upper band = 20 + (2 * 10)
Upper band = 20 + 20
Upper band = 40
Similarly, we can follow same procedure to calculate the lower band
Lower band = EMA - 2 * ATR
Lower band = 20 - (2 * 10)
Lower band = 20 - 20
Lower band = 0

4. What's your understanding of Trend confirmation with Keltner Channels in either trend? What does sideways market movement looks like on the Keltner Channels? What should one look out for when combining 200MA with Keltner Channel? Combine a 200MA or any other indicator of choice to validate the trend. (Separate screenshots required)

The first thing a trader looks at before taking any crypto trading decision is the direction of the trend of that particular asset. This means that for a trader to be able to place a buy or sell order, he must understand the direction which the trend is going. The keltner indicator is a very great tool which helps to identify the direction of this trend. Let's consider how to dictate this trend below using the keltner channel indicator.
Trend confirmation in uptrend
For the uptrend, you will notice price as well as the indicator moving in an upward direction. Once the price formation is seen between the upper band and the middle band (EMA line), then we can say the trend in question is bullish in nature. In this case, the upper band will serve as resistance and the middle band will serve as support to the price action. Let's see the screenshot below.
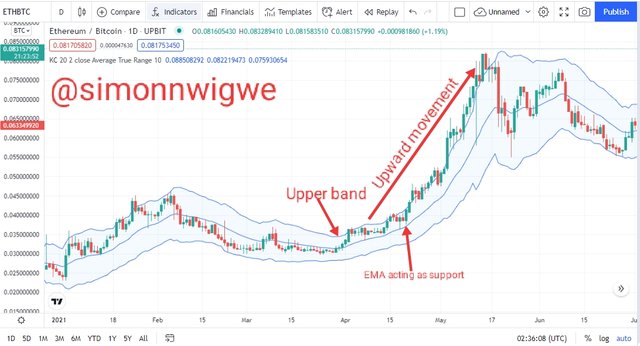
The screenshot above shows the keltner channel indicator moving in same direction as the price action. The upper band as we can see is acting as a resistance and the middle band is acting as a support. Price chart is seen between the the upper band and the middle band which is a clear indication of a bullish trend as I have explain earlier.
Trend confirmation in downtrend
For the downtrend, you will notice price as well as the indicator moving in a downward direction. Once the price formation is seen between the lower band and the middle band (EMA line), then we can say the trend in question is bearish in nature. In this case, the lower band will serve as support and the middle band will serve as resistance to the price action. Let's see the screenshot below.
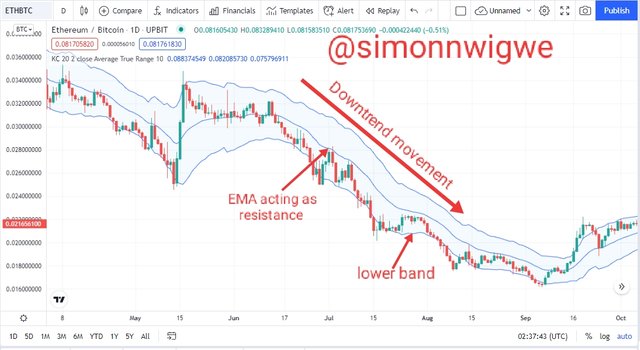
The screenshot above shows the keltner channel indicator moving in same direction as the price action. The lower band as we can see is acting as a support and the middle band is acting as a resistance. Price chart is seen between the the lower band and the middle band which is a clear indication of a bearish trend as I have explain earlier.
sideways market and the keltner channel
The case of the sideways movement, the trade here is not in trending I.e it is not moving in downward or upward direction. Here the trade is moving in a sideways direction. The market at this point is not dominated by buyers or sellers. They are all in the market without any of them taking total control of the market. In this case, using the keltner indicator, the upper band normally acts as the resistance level whereas the lower band acts as support level. Let's see the screenshot below.
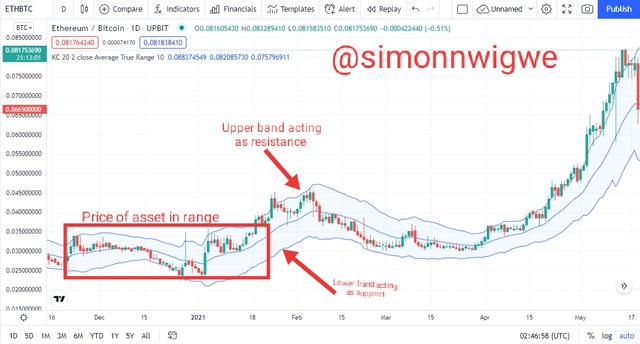
The screenshot above shows the keltner channel indicator, and the upper band acting as a resistance whereas the lower band acts as support. The indicator is seen moving in a range without any trend.
Combining 200 MA and the keltner channel indicator
In other to filter false signal and then minimize losses when trading, it is recommended to use more than one indicator on your chart analysis and trading decision. In confluence trading, two or more technical analysis tools or trading pattern is needed to be able to make a proper trading decision. Combining the 200 MA and the keltner channel indicator will improve our trading decision and also help us minimize loss and maximize profit. Let's apply them in our different trading cases and see the effect.
In Uptrend
When the indicators are applied in a chart to confirm the bullish movement of the trade, you have to notice the 200 MA line below the price chart and also below the keltner channel indicator. All of which will be moving in an upward direction. Let's consider the screenshot below.
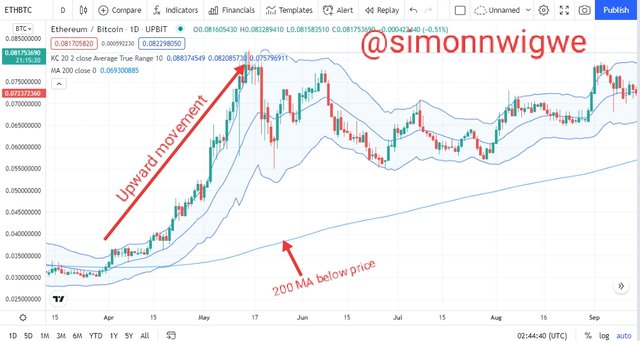
From the screenshot above, the 200 MA is seen below the price chart and the keltner channel indicator and that has confirmed the bullishness of the trade in question.
In Downtrend
When the indicators are applied in a chart to confirm the bearish movement of the trade, you have to notice the 200 MA line above the price chart and also above the keltner channel indicator. All of which will be moving in an downward direction. Let's consider the screenshot below.
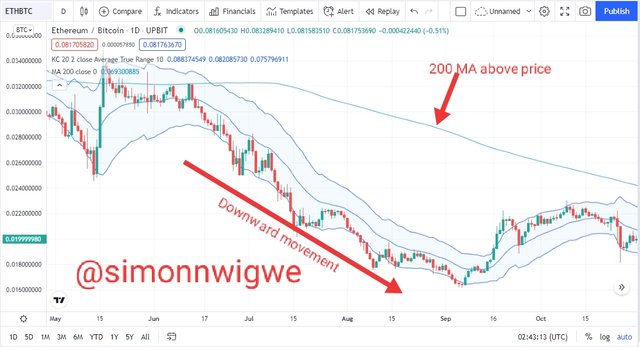
From the screenshot above, the 200 MA is seen above the price chart and the keltner channel indicator and that has confirmed the bearishness of the trade in question.
In sideways Market
Here in this case, the 200 MA line will be seen with the price chart and the keltner indicator. This is simply meaning that there is no trend in the market. As I said earlier both buyers and sellers are not in total control of the market at this point. Let's consider the screenshot below.
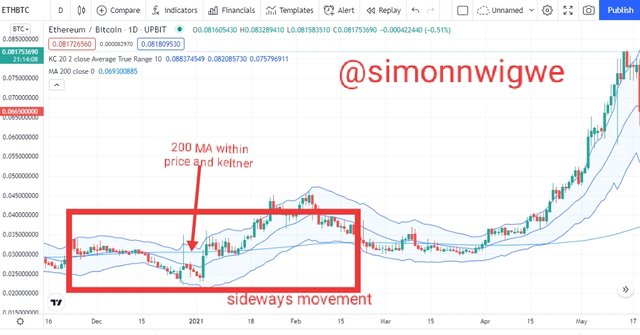
From the screenshot above you have seen that the 200 MA line is seen within the price chart and the keltner channel and that indicates the absent of any trend in the market.

5. What is Dynamic support and resistance? Show clear dynamic support and resistance with Keltner Channels on separate charts. (Screenshots required).

When a market is trending, we normally see points where the prices goes up and come down. This points are known as the dynamic support and resistance points. Trendline can be drawn on chart to show resistance in a chart. Normally, the resistance level are seen above the candlesticks whereas the support levels are seen below the candlestick chart.
The keltner channel indicator is also use to spot this dynamic support and resistance level in a crypto chart. Recall that we made mention of the three lines that is contained in the keltner indicator I.e the upper band, middle band and the lower band. The upper band always acts as a resistance level, whereas the lower band often act as a support level. Let's consider the charts below as we wi be identifying the resistance and support level on a chart.
Dynamic Resistance (Uptrend)
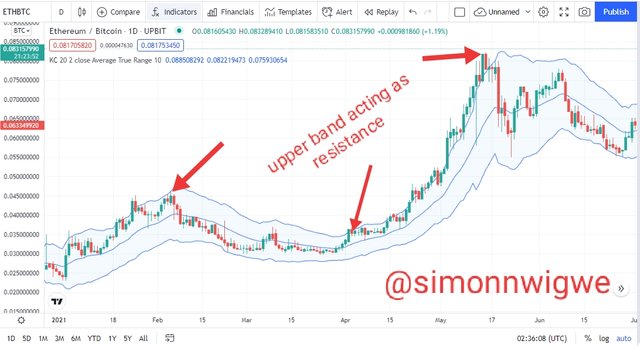
From the screenshot above, we can see that the price chart is in trending I.e it is moving in an upward direction. The keltner indicator was applied and the trend movement was confirmed. The upper band here acts as the dynamic resistance level as marked in the chart above.
Dynamic Support (Downtrend)
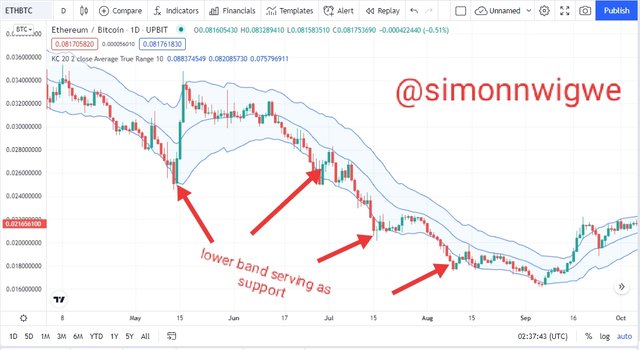
From the screenshot above, we can see that the price chart is in trending I.e it is moving in a downward direction. The keltner indicator was applied and the trend movement was confirmed. The lower band here acts as the dynamic support level as marked in the chart above.

6. What's your understanding of price breakouts in the Crypto ecosystem? Discuss breakouts with Keltner Channels towards different directions. (Screenshots required).

Price Breakout in crypto ecosystem is a scenario where the price lives the range zone or sideways zone and goes either upward or downward. This means that the price moves to either the resistance level or support level after leaving the range level. Breakout in other words is the process where the price of an asset breaks from it's initial movement between the support and the resistance level and goes either upward to the resistance zone or downward to the support zone.
Breakout is also seen and determined using the keltner channel indicator. We know that for a breakout to occur, it means volatility of price has set in. This means that for price to breakout and move to either the resistance zone or the support zone there must have been some volatility in the price of the asset. The keltner indicator always confirms this breakout as the indicator is seen going towards the direction where this breakout is going.
Keltner Channel Bullish breakout
Breakout in resistance level means that the trend tends to continue in it's movement upward. I explained earlier that when a breakout takes place between the EMA line and the upper band in an upward direction it signifies that buyers are in total control of asset at that point. This is a bullish breakout. This is normally confirm by the keltner indicator as we see price breaking and closing above the upper band.
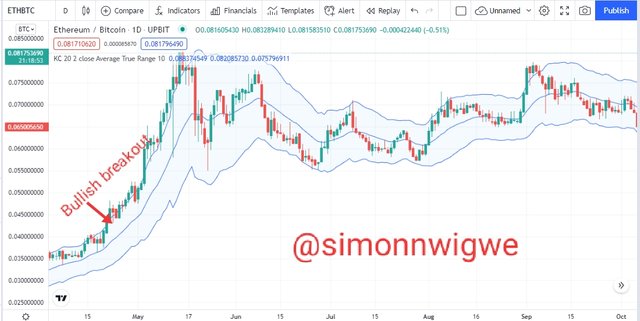
From the screenshot above, we can see how the price broke and then moved closed above the upper band. Here the EMA line served as a support whereas the upper band line serve as resistance. The keltner moves in same direction as the price action confirming the breakout signal.
Keltner Channel Bearish breakout
Breakout in support level means that the trend tends to continue in it's movement downward. I explained earlier that when a breakout takes place between the EMA line and the lower band in a downward direction it signifies that sellers are in total control of asset at that point. This is a bearish breakout. This is normally confirm by the keltner indicator as we see price breaking and closing above the lower band.
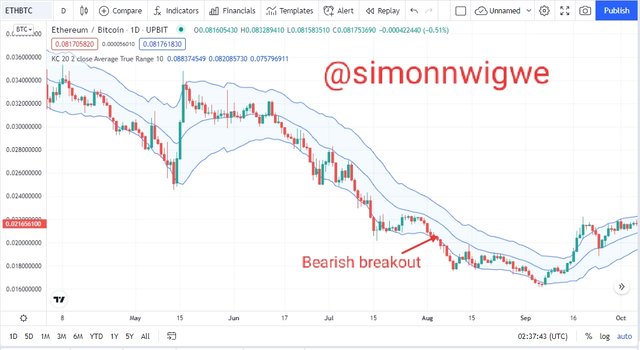
From the screenshot above, we can see how the price broke and then moved closed below the lower band. Here the EMA line served as a resistance whereas the lower band line serve as support. The keltner moves in same direction as the price action confirming the breakout signal.

7. What are the rules for trading breakouts with Keltner Channels? And show valid charts that work in line with the rules. (Screenshot required).

The rules for trading breakouts with keltner channels are quite very simple. Firstly, we should know where the breakout is happening. If it is breaks above the upper channel, it means that resistance has been broken. In the same way, if it breaks below the lower band we say that support has been broken.
Rules for trading bullish breakout with keltner channel
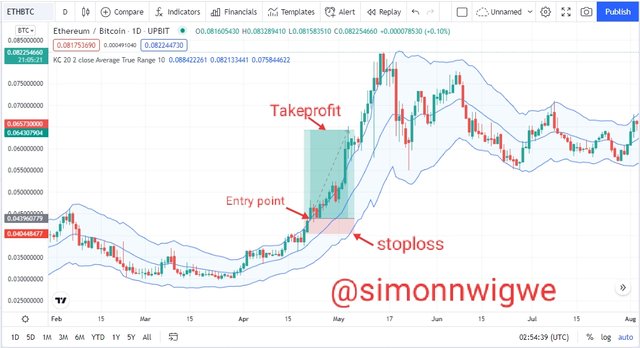
Firstly, be sure that the movement of the price of the asset are seen between the EMA (Middle line) and the upper band. At this point, look for where the price breaks and moves close to the upper band.
After that, allow the price to retract and then move in downward direction.
The price is expected to move downward, and when it is seen within the middle band, the EMA here will act as a support to the price. Here after that has been seen, allow the price to move above two or three candle then you open a buy entry within that point.
In terms of risk management, the stop loss of such a trade should be placed immediately below the EMA line I.e the line that served as support. Another important thing is that a risk reward ratio of at least 1:1 or 1:2 is to be taken into consideration.
Rules for trading bearish breakout with keltner channel
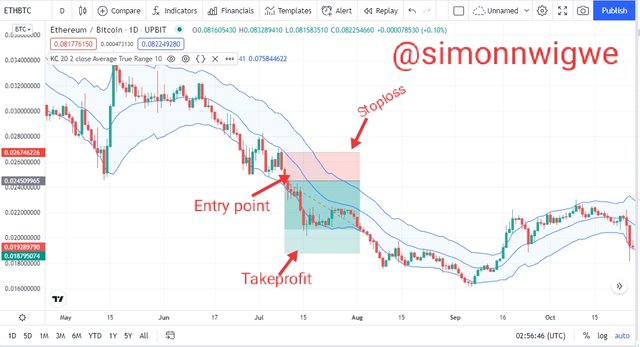
Firstly, be sure that the movement of the price of the asset are seen between the EMA (Middle line) and the lower band. At this point, look for where the price breaks and moves close to the lower band.
After that, allow the price to retract and then move in upward direction.
The price is expected to move upward, and when it is seen within the middle band, the EMA here will act as a resistance to the price. Here after that has been seen, allow the price to move below two or three candle then you open a sell entry within that point.
In terms of risk management, the stop loss of such a trade should be placed immediately above the EMA line I.e the line that served as resistance. Another important thing is that a risk reward ratio of at least 1:1 or 1:2 is to be taken into consideration.

8. Compare and Contrast Keltner Channels with Bollinger Bands. State distinctive differences.

There exist a lot of similarity between the Keltner channels and the bollinger band indicator. Few of the similarity include the fact that both of them have 3 bands I.e the upper, middle and the lower band. As a matter of fact, when both indicator as seen in a chart, it's difficult to say which is on the chart because of the similarity between their looks.
The indicators are both use to dictate the trend direction of the price of an asset and they are both volatile based indicators. Both indicators has similar ways of determining the trend direction of the price of an asset. Let's consider the screenshot of both indicators as been applied on a chart below.
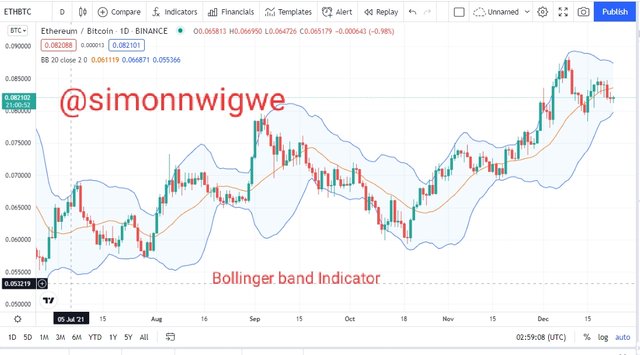
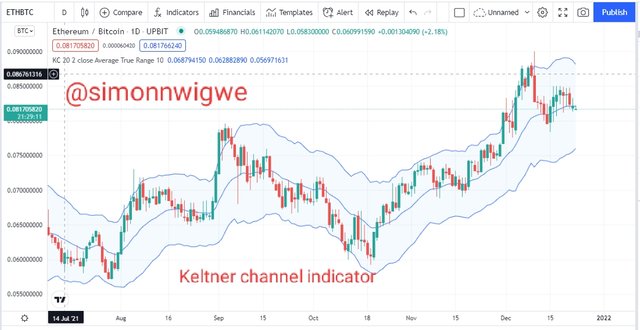
From the screenshots above it's nearly impossible to different between the both indicators by just looking at them on a chart. They all look alike in the chart as we can see above. Haven seen the the similarity between the both indicators, let's carefully look at the difference between the indicators.
In the bollinger band indicator, the upper and the lower band is derived via standard deviation of the price whereas in the case of the keltner channel indicator, the upper and the lower bands are derived by making use of the ATR.
Another difference between both indicator is that to dictate a strong trend the bollinger band is always used whereas, to dictate a slower trend the keltner channel is used.

9. Place at least 4 trades (2 for sell position and 2 for buy position) using breakouts with Keltner Channels with proper trade management. Note: Use a Demo account for the purpose and it must be recent trade. (Screenshots required).

Buy Entry
Trade 1: This is a trade entry of the pair of ZEC/USD which was placed for 15 minutes timeframe. From the screenshot below, the entry point was taken immediately above the EMA line which implies that it is a bullish region and a buy entry is allowed within that point.
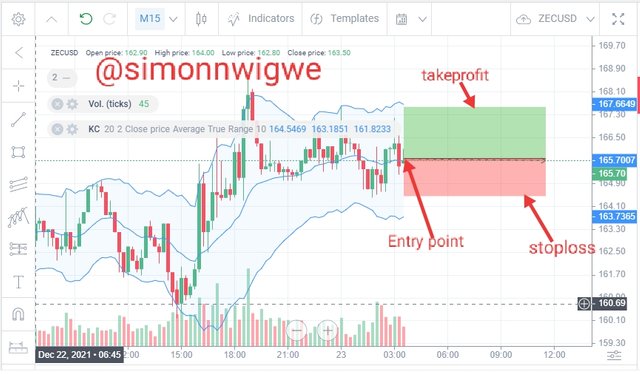
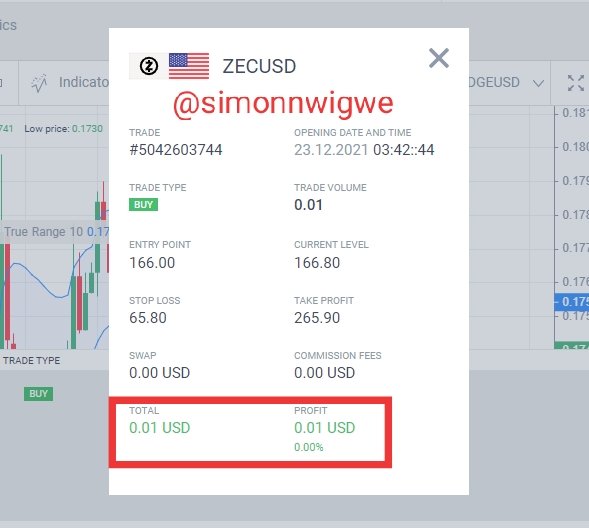
The stoploss and the take profit level was taken into consideration and all risk management was put in place as well to minimize losses. At the end of the trade, the result shows that we made a profit and that implies that the strategy worked well. See screenshot below.
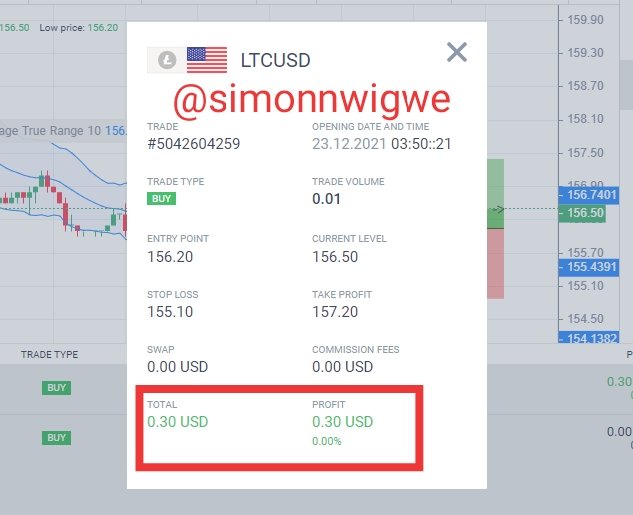
Trade 2: This is a trade entry of the pair of LTC/USD which was placed for 5 minutes timeframe. From the screenshot below, the entry point was taken immediately after the 2nd bearish candle above the EMA line which implies that it is a bullish region and a buy entry is allowed within that point.
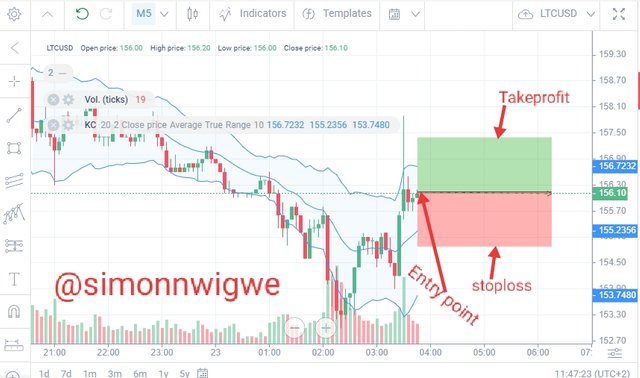
The stoploss and the take profit level was taken into consideration and all risk management was put in place as well to minimize losses. At the end of the trade, the result shows that we made a profit and that implies that the strategy worked well. See screenshot below.
Sell Entry
Trade 1: This is a trade entry of the pair of BTC/USD which was placed for 15 minutes timeframe. From the screenshot below, the entry point was taken immediately below the EMA line which implies that it is a bearish region and a sell entry is allowed within that point.
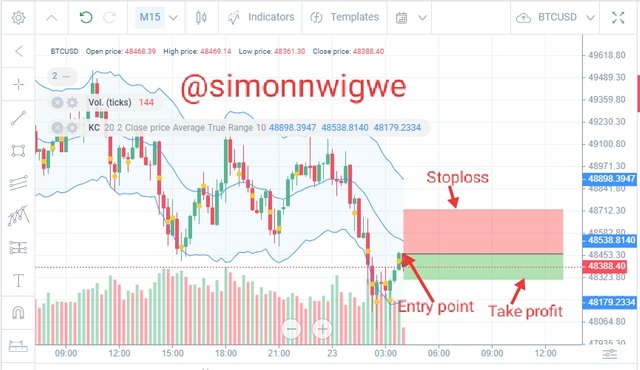
The stoploss and the take profit level was taken into consideration and all risk management was put in place as well to minimize losses. At the end of the trade, the result shows that we made a profit and that implies that the strategy worked well. See screenshot below.
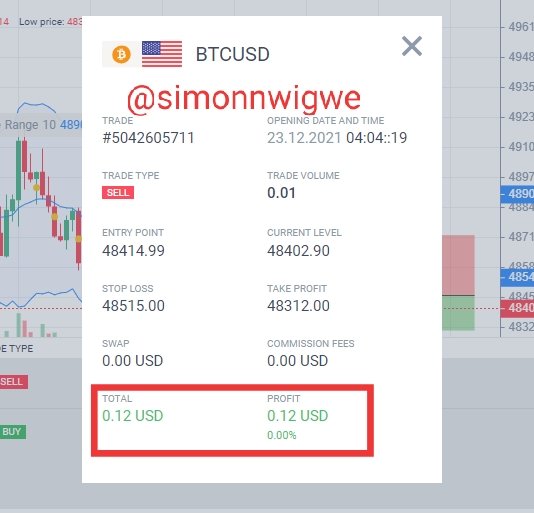
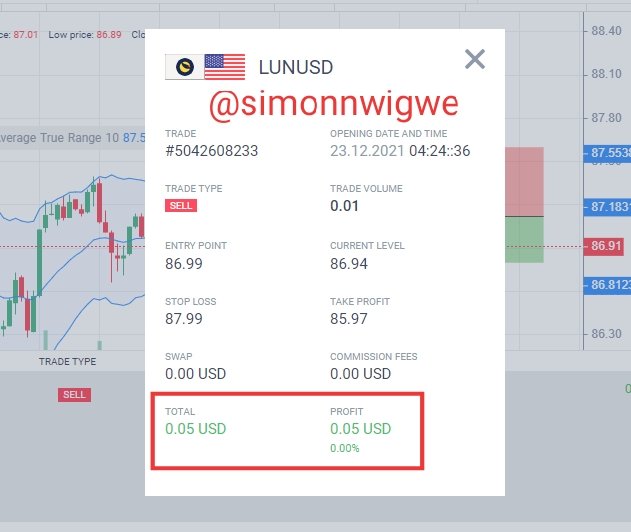
Trade 2: This is a trade entry of the pair of LUN/USD which was placed for 1 minute timeframe. From the screenshot below, the entry point was taken after two bearish candle immediately below the EMA line which implies that it is a bearish region and a sell entry is allowed within that point.
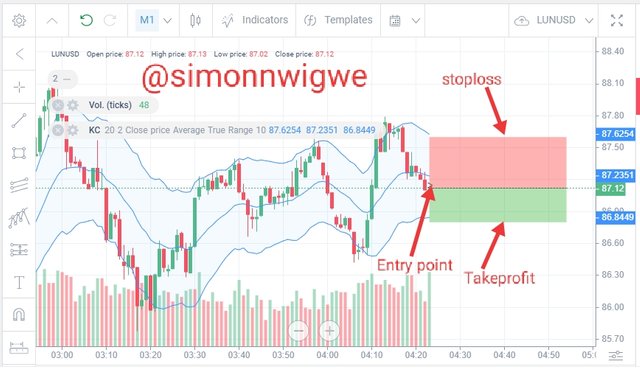
The stoploss and the take profit level was taken into consideration and all risk management was put in place as well to minimize losses. At the end of the trade, the result shows that we made a profit and that implies that the strategy worked well. See screenshot below.

10. What are the advantages and disadvantages of Keltner Channels?

The advantages of the keltner channel indicator are listed below.
The indicator is a volatility indicator, this means that it is very good when it comes to measuring price volatility
When ever the trader sees a breakout in either the lower band or the upper band, it's a clear signal for the trader to enter a trade.
The indicator is simply to read and understand. This means that even those who are not too familiar with indicators can make use of the keltner channel indicator.
Trend confirmation is easy when using the Keltner channel. This is because if price is found between the middle and upper band we identify it as bullish but if it is found between the middle and the lower band we identify it as bearish.
The disadvantages of the keltner channel indicator are listed below.
False signal can be seen from the indicator as it is not 100% guaranteed. Therefore it must be combine with other indicator to filter it.
There are possibility of late trend confirmation. This will lead to traders losing opportunities to enter the trade at the right time.
Charts using the Keltner indicator has different view in different timeframe. This means that if you view the chart of BTC/USD in 10 minutes timeframe and then view it again in 20 minutes the charts will differ.

Conclusion

The keltner indicator is a volatile base technical analysis tool. This means that it is an indicator that is use to measure the volatility of the price of an asset. The indicator among other things helps traders to spot the trend direction, serve as support and resistance tools it also help traders to enter or exit a trade at the proper time.
As we have already know, no indicator is 100% effective when it stand alone hence it is always recommended that the indicators be combined with other technical analysis tools to obtain a more reliable signal. The case of the Keltner channel indicator is not an exception. The indicator perform better when combine with 200MA or any other indicator.
My sincere gratitude goes to the professor in the person of
@fredquantum for such an educative lecture. I have really learnt a lot about the keltner channel indicator and I do hope to continue learning more from you as the academy progresses.

Note: All screenshots are my original image and are taken from trandingview.com


Downvoting a post can decrease pending rewards and make it less visible. Common reasons:
Submit