Greetings my fellow crypto lovers, it is already week 6 of the Steemit engagement challenge for season 19 and I'm delighted to also share my participation in this contest today. This week the topic of discussion is Trading Steem with TD Sequential. This is not a familiar indicator to me so it means more research and studies are needed to be able to drop my entry and to use the indicator effectively.
Background image Edited on Canvas
Every new task requires more work and for that reason, I see a new task as an opportunity to explore and learn new things. This week I'm going to take a lot of time to research this tool and as a trader, I will apply it to see how effective the result obtained will be. This is going to be a long ride as this week's questions have a lot in them. I want to advise that if you want to read through this post, get a bottle of Coke and Crackers biscuits before starting because it will be a very long ride. Without further ado let's get started.
| Question 1: Understanding the TD Sequential Indicator |
|---|
Theory: Explain what the TD Sequential Indicator is and how it differs from other commonly used trading indicators. In your explanation, mention the concepts of "TD Setup" and "TD Countdown" and their importance in the context of cryptocurrency trading.
Before we go ahead to explain what the TD sequential Indicator is all about, it is important we first know the brain behind this great work and when this work came into existence. Thomas Demark popularly known as Tom Demark is the founder of the TD sequential indicator and this indicator was developed in the 1980's. This tool was first seen in the book written by Tom Demark which goes with the title "The New Science of Technical Analysis" in 1985. Having established this fact, let's go straight into what the indicator is all about.
There are times when we expect a trend to reverse because it has gotten to its overbought or oversold region but we see that the price doesn't do that instead it keeps moving upward or downward as the case may thereby overextending the movement. As a trader, you need a tool to use in such situations to know when the market will finally reverse respecting the laws of overbought and oversold.
This is where the concept of the TD sequential indicator came about. This tool is used to measure overextended market movement and thereby spot possible trend reversal points. When the market begins to lose its strength while moving in a certain direction, the TD sequential indicator spots it and also tells when a reversal will be possible from that movement.
The TD sequential indicator is made up of two concepts i.e., TD setup and the TD countdown. I would like to explain these concepts one after the other below.
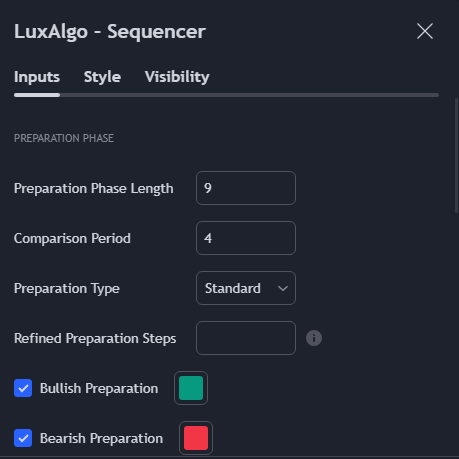
TD Setup: This is the initial phase of the indicator and it involves the 9 candlesticks moving in sequence either upward or downward. To get the direction of the market, you will need to compare the closing of the current candle with that of the 4 candles earlier. If for instance, you have 9 consecutive candles moving in sequence and the current candle is candle number 9, you are to compare it closing with the closing of candle 5. I will explain these more as we progress.
 |  |
|---|
Properties of the indicator used
Let's look at TD's setup for bullish and bearish phases of the market and how to spot them.
Bullish TD Setup: For bullish TD Setup, the closing price for each of the 9 consecutive candles must be lower than the close of the 4 candles earlier.
Bearish TD Setup: For bearish TD Setup, the closing price for each of the 9 consecutive candles must be higher than the close of the 4 candles earlier.
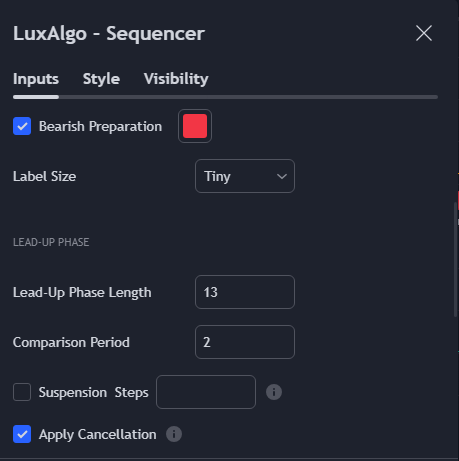
TD Countdown: After the TD Setup phase, the next phase that sets in is the TD countdown phase which has about 13 candles. Here what the TD countdown does is confirm the exhaustion of the trend that was identified in the TD Setup. When the countdown reaches 13 it means that the trend has exhausted and a reversal to the opposite direction is possible.
Properties of the indicator used
We also have the TD countdown for bullish and bearish so let's look at them and how they work.
Bullish TD Countdown: Here, the close of the current candlesticks must be lower than the low of two candles earlier. Recall that 13 candles are taken into consideration here.
Bearish TD Countdown: Here, the close of the current candlesticks must be higher than the high of two candles earlier. Recall that 13 candles are taken into consideration here.
Importance in the context of cryptocurrency trading
The importance of the TD sequential Indicator in the context of crypto trading can never be overemphasized. As you all know Cryptocurrency is highly volatile and that is the reason why sometimes we see the market move extremely and remain in the overbought and oversold region for a while. To know when the market will make a reversal after such a move we need the TD sequential indicator to determine that. The following are a few of the importance of TD sequential in trading cryptocurrency.
Identifying trend exhaustion: One of the main aims of the indicator is to identify trend exhaustion and then with the help of the TD setup and the TD countdown traders will know when there is the possibility of a trend reversal.
Entry and Exit for traders: Since the indicator is used to know when the trend strength is getting weak and the countdown also tells you when the trend finishes, if you have a bullish setup and countdown you can consider exiting short and look for a long entry, and if you have bearish setup and countdown you should consider exiting long and look for a short entry.
Use to identify support and resistance levels: The support and resistance levels are levels where prices always reverse so using the TD sequential indicator you can see where the price movement started and where it ended those points can act as support and resistance levels for the trade.
How it differs from other commonly used trading indicators
There are a few differences between the TD sequential indicator and other commonly used indicators and some of these differences are what we will be looking at below.
Used to identify trend exhaustion and continuation: unlike other indicators such as RSI which only tells a trader that the market is either overbought or oversold, the TD sequential indicator tells trade about the trend exhaustion, and this gives them an idea of potential reversal of the market once the TD countdown completes.
Uses counting mechanism: The TD indicator uses a counting mechanism, in the TD setup we talked about 9 consecutive candles, and in the TD countdown we talked about 13 candles. Other indicators don't use the counting mechanism they only focus on price momentum.
Uses sequential counting process: The indicator is somewhat complex because of the information on the various candles and you must know how to count sequentially to be able to use the indicator. This counting mechanism is not found in most indicators or they have been simplified but here you must still do the task of counting.
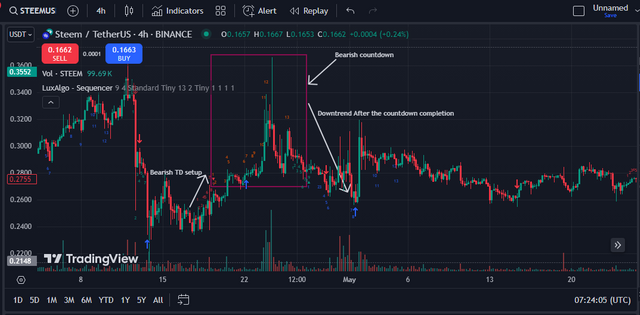
Practice: Choose a cryptocurrency pair including STEEM (e.g., STEEM/USDT) and identify the TD Setup and TD Countdown sequences on a 4-hour chart. Describe the observations you make and what they mean for a trader.
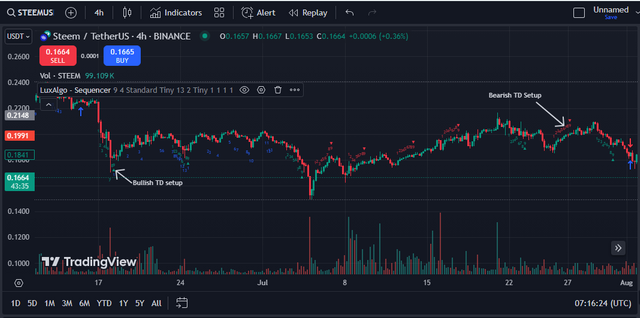
Here I'm choosing the STEEM/USDT pair on a 4H timeframe frame. As the first step towards answering this question. Secondly, I applied the needed indicator in this case LuxAlgo - Sequencer. The image below shows the TD Setup for the Bullish and Bearish movement of the asset.
As earlier explained the bullish TD setup is identified by seeing the current candle lower than the early 4 candle in a sequence of 9 candles. Here in this screenshot, the bullish TD setup is identified with green numbering from 1-9. This means the market is in downtrend and will be moving to uptrend soon.
Similarly, the bearish TD setup is identified by seeing the current candle higher than the early 4 candles in a sequence of 9 candles. Here in this screenshot, the bearish TD setup is identified with red numbering from 1-9. This means the market is in uptrend and will be moving to downward soon.
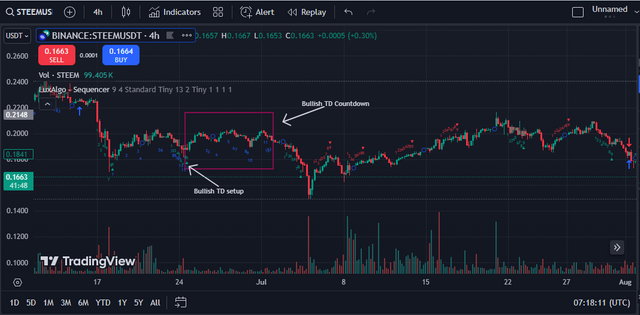
For the TD countdown, let's also look at the bullish and the bearish TD countdown as seen in the image below. As explained earlier the countdown is made up of 13 candles and in the bullish countdown the closing price must be lower than two candles earlier from this screenshot below the numbering of the bullish countdown is done with blue 🔵 color.
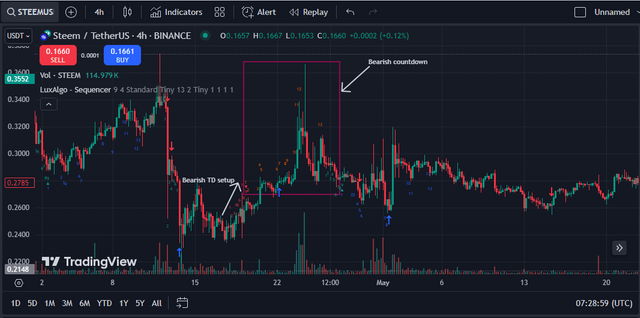
In the same way, for the bearish countdown, the closing price must be higher than the two candles earlier from the sequence of the 13 candles in the screenshot below the numbering of the bearish countdown is done with an orange 🍊 color.
My Observations & what they mean for a trader
Bullish TD Setup and Bullish Countdown: looking carefully at the market, you will notice that the market was in a downtrend, and the TD setup was spotted as we saw 9 consecutive candles where the closing of the last candle was lower than the four candles earlier proving that it is a bullish TD setup.
Immediately after the bullish TD setup I also observed a bullish countdown where there are 13 consecutive candles and the closing price of the last is lower than two candles earlier as seen in the screenshot above. This means that the market downtrend movement is coming to an end a potential reverse in the opposite direction is very likely possible.
Bearish TD Setup and Bearish Countdown: looking carefully at the market, you will notice that the market was in an uptrend, and the TD setup was spotted as we saw 9 consecutive candles where the closing of the last candle was higher than the four candles earlier proving that it is a bearish TD setup.
Immediately after the bearish TD setup I also observed a bearish countdown where there are 13 consecutive candles and the closing price of the last candle is higher than two candles earlier as seen in the screenshot above. This means that the market uptrend movement is coming to an end a potential reverse in the opposite direction is very likely possible.
Based on the above observations, a trader who has spotted the bullish setup and countdown may decide to wait for confirmation and then enter to long the market. Also if the trader is in a short position he or she may need to exit the market because the trend is about to change.
In the same way, a trader who has spotted the bearish setup and countdown may decide to wait for confirmation and then enter to short the market. Also if the trader is in a long position he or she may need to exit the market because the trend is about to change.
| Question 2: The Psychology behind the TD Sequential |
|---|
Theory: Describe the psychology underlying the use of the TD Sequential Indicator. How can this indicator influence traders' decisions and the dynamics of the cryptocurrency market?
The basic psychology behind the TD sequential indicator is herd behavior and trend exhaustion, confirmation bias, and market sentiment fear and greed cycles.
Herd behavior & Trend exhaustion: Traders always like following the crowd. If many people start buying a particular asset and others see they too will buy and that helps to continue pushing the momentum in the market and that is what makes the market go to trend exhaustion here traders use the numbering system for TD setup and the TD countdown to identify when the market will reverse.
Confirmation bias and market sentiment: Since the indicator has been designed to obey certain rules, traders always hold on to that belief. So as they enter a long or short they will wait for a setup and countdown before they can exit the market. Also in the aspect of market sentiment, traders are aware that when the setup and countdown are over the trend has to reverse in the opposite direction hence they prepare themselves for that.
Fear and greed are another major psychology that we see when using the TD sequential indicator. If the market continues upward some traders will continue holding their position because they believe there should be a setup and countdown before a different direction can be taken. Also fear sets in when the downtrend is overextended because traders may think that this asset may be crashing and they will quickly sell so that they don't lose everything.
How can this indicator influence traders' decisions and the dynamics of the cryptocurrency market?
There are many ways in which this indicator influences trader decisions and a few of them are what we will be looking at below.
Since traders have a clear understanding of how the indicator works as it provides a clear rule for trend exhaustion and reversal traders can use that to know when a trend is going to reverse and thereby make a decision that will favor him or her in the market.
Since the aim of the indicator is to spot trend exhaustion and reversal, traders can easily exit their trade when they notice it and that will save them from loss and also it will help prepare them for the next entry. So it helps traders for entry and exit of their trade.
To be a successful trader you must have good risk management strategies and the TD sequential indicator helps you to do that Based on the information provided you can know when the trend will end and where a new trend will start. Here you will set you take profit and stop loss very well so that you don't get to lose much if anything happens in the market.
Now, let's look at the impact of the dynamics of this decision on the cryptocurrency market.
If many traders use the TD sequential indicator and obey the rules simultaneously you will notice that the market will make the required moves immediately showing how perfect the indicator is in calculating the movement.
Based on the above point, you will also notice an increase in volatility in the market if traders and institutions act in the same direction at the same time.
Based on the over-exhaustion of the market in upward or downward directions, many traders will stand and wait for reversal and will immediately enter the market once it reverses.
Practice: Based on a recent example, discuss how traders' psychology might have influenced the price of STEEM when TD Sequential signals appeared. Use historical charts to illustrate your point of view.
Bullish TD setup & it's psychological impact
Considering the chart below, you will notice that the market is in a strong downtrend and the bullish TD setup shows up as you can see we have 9 numbers in a sequence and the closing price of the current candle is lower than the closing price of four candles earlier. This is a confirmation that it is a bullish TD setup.
As a trader, seeing this movement based on the rules of the TD sequential, I will want to believe that the downtrend is overextended and for that reason, a possible reversal will surely happen. So I've decided to take profit since I'm expecting a trend reversal soon based on the rules of the TD sequential Indicator.
Bullish TD countdown & it's psychological impact
Also, after the TD setup, a TD countdown surfaces which shows a sequence of 13 candles with the current closing price lower than the two earlier which shows downtrend exhaustion.
As a trader, seeing this movement based on the rules of the TD sequential, I will want to believe that there is trend exhaustion and for that reason, a possible reversal will surely happen. With the completion of the countdown, we see a buying pressure.
Bearish TD setup & it's psychological impact
Considering the chart below, you will notice that the market is in a strong uptrend and the bearish TD setup shows up as you can see we have 9 numbers in a sequence and the closing price of the current candle is higher than the closing price of four candles earlier. This is a confirmation that it is a bearish TD setup.
As a trader, seeing this movement based on the rules of the TD sequential, I will want to believe that the uptrend is overextended and for that reason, a possible reversal will surely happen. So I've decided to take profit since I'm expecting a trend reversal soon based on the rules of the TD sequential Indicator.
Bearish TD countdown & it's psychological impact
Also, after the TD setup, a TD countdown surfaces which shows a sequence of 13 candles with the current closing price higher than the two earlier which shows that the uptrend is overextended.
As a trader, seeing this movement based on the rules of the TD sequential, I will want to believe that there is trend extended and for that reason, a possible reversal will surely happen. With the completion of the countdown, we see a selling pressure.
| Question 3: Explanation of the TD Setup |
|---|
Theory: Describe in detail the conditions necessary for a TD Setup to be completed. What specific criteria should be monitored, and why are they crucial for a trader?
For a TD Setup to be completed, some conditions must be met and below I would like to share with you all the necessary conditions that must be met and why they are crucial.
Trend identification: Before a TD setup is complete, traders must identify the trend of the market as it is the first step towards TD setup completion. The bullish TD setup occurs during a downtrend and signals a reversal to the uptrend whereas the bearish TD setup occurs during an uptrend and signals a reversal to the downtrend.
This step is crucial because it tells you if the market is going to reverse or if it will continue. The setup and countdown also tell you about trend exhaustion.
Consecutive 9 bar count: The setup is valid and complete when we have 9 consecutive bars in which the last price closes must be lower than the close of four bars earlier in the case of a bullish TD setup also the last price closes must be higher than the close of four bars earlier in the case of a bearish TD setup.
These are crucial because they help to tell the trader about the momentum of the market and also tell them that the trend may be overextended. With such movement, it also informs traders that the trend is coming to an end and a confirmation can be down when the countdown shows.
Adherence to the setup condition: As I have said earlier the condition must be obeyed within the 9 consecutive candles and if there is any interruption where any of the bars don't meet the criteria then that sequence must be canceled.
It is crucial to obey this because it helps to reduce fakeouts and also keeps you in the market and only presents a valid signal.
TD setup cancellation: TD setup cancel and then reset if the conditions are not met. In the bullish setup, if the market closes above the highest high then the setup becomes invalid. Similarly, for a bearish setup if the market closes below the lowest low then the setup becomes invalid.
It is crucial to spot fake signals. If there is a trend reversal during the setup phase it means that the setup is no longer valid and for that reason, it will be cancelled.
Practice: On a daily chart of the STEEM/BTC pair, identify a recent TD Setup and explain how a trader could have used this information to make a trading decision. Include screenshots and an analysis of the results obtained.
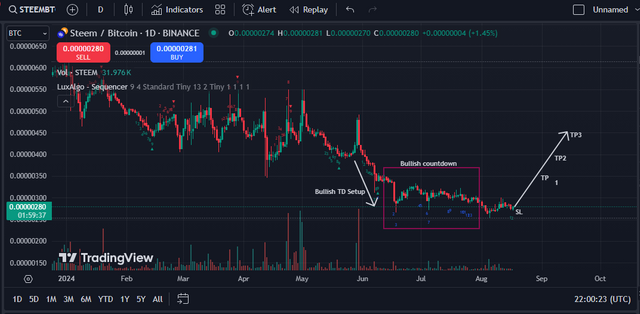
The screenshot below shows a recent chart of the STEEM/BTC pair on a 1D timeframe and from the screenshot you can see that the TD setup I was able to identify was the bullish TD setup which means that the market is going downward and the next expected move should be an uptrend.
After the completion of the 9-sequence candle which represented the bullish TD setup, and the trend didn't reverse we saw the Bullish TD countdown appearing immediately as well. As you all know the TD countdown is made up of 13 candles and that confirms that the trend has exhausted and a possible reversal is possible.
So seeing that all the criteria have been met, I decided that the best option to go for such a market at this point is long. Seeing the above screenshot you can see that I have set my chat and I'm expecting at least 3 Take profit levels and my stop loss below the current candlestick.
This will help protect my account in case the market goes against me. So any trader who knows about the TD sequential indicator and understands how it works will look for a buying opportunity here because the market has passed the criteria which should lead to buying the market.
We have seen a bullish TD setup and a bullish countdown which are all signs that the current bearish trend has ended and a bullish trend is about to take the lead. So we will continue watching the market and see how this analysis goes.
Importantly, you must always have a target which is your TP level and you must also protect your account by adding a stop loss level to your trade. So in this way, you won't have to be scared of trading this asset.
| Question 4: Using TD Countdown to Predict Reversal Points |
|---|
Theory: Explain the TD Countdown process and how it can be used to predict market reversal points. What is the difference between TD Setup and TD Countdown in their practical application?
The second phase of the TD sequential Indicator is the TD countdown. This is used to confirm if the trend exhaustion that was identified by the TD setup will lead to continuation or it will lead to reversal and that is where informed decisions are made to hold or exit the position.
Some of the processes and how it is used to predict market reversal are seen below.
Sequential counting: The TD countdown is made up of 13 candlesticks for both bullish and bearish countdowns but is not followed consecutively as in the case of the TD setup. Some of the candles that don't meet the criteria are discarded but the sequence is continuous and the one that meets the criteria
Bullish Countdown: The close of each bar here must be lower than the low of two bars earlier. This signal shows that the downward movement is exhausted and a possible reversal is possible.
Bearish Countdown: The close of each bar here must be higher than the high of two bars earlier. This signal shows that the upward movement is extended and a possible reversal is possible.
Nonconsecutive bar: The bars here are not consecutive as there are some within the sequence that don't meet the requirements hence they are discarded. So in any form of market be it choppy or trending the countdown can work effectively.
TD countdown completion: Once the TD countdown completes it means that the trend has reached its elastic limit and the exhaustion or extension will have to come to an end for the trend to reverse in the opposite direction.
How it can be used to predict market reversal points.
In the bullish TD setup, we see the market declining, and if the market doesn't reverse after the 9 sequence candle then a TD countdown sets in, and after the completion of that countdown, the market might likely have reached the last point and the next option it has is to reverse and go upward.
Similarly, In the bearish TD setup, we see the market going upward, and if the market doesn't reverse after the 9-sequence candle then a TD countdown sets in, and after the completion of that countdown, the market might likely have reached the last point and the next option it has is to reverse and go downward.
What is the difference between TD Setup and TD Countdown in their practical application?
The table below shows some differences between the TD Setup and the TD countdown.
| TD Setup | TD Countdown |
|---|---|
| Use to identify trend reversal due to trend exhaustion or extension | Use to confirm if the trend exhaustion and trend extension given by TD setup is strong enough |
| It is triggered when 9 consecutive bars meet the criteria | It is triggered when 13 bars meet the criteria |
| Here it gives traders a sign that the trend is about to reverse and some traders can enter the market without confirmation | Here the confirmation signal given is confirmed to some extent and then traders may enter or wait for complete reversal as well. |
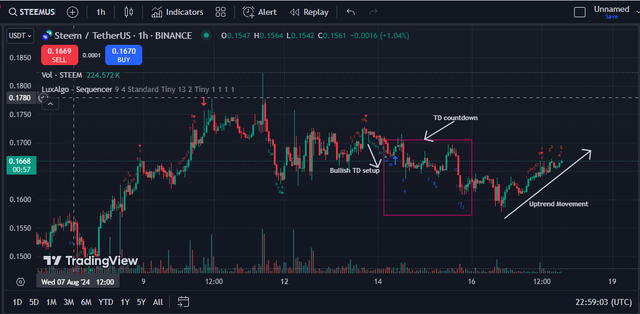
Practice: On a 1-hour chart for STEEM/USDT, find a complete TD Countdown sequence and analyze how it influenced trading decisions. Did you observe a trend reversal at the end of the TD Countdown? Provide a detailed analysis.
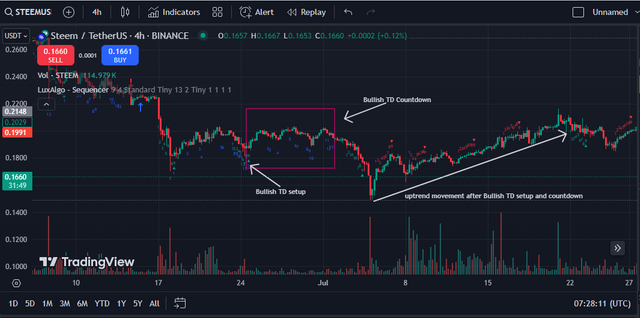
The chart below is the pair of STEEM/USDT on a 1H timeframe. Now the essence of this chart is to identify a complete TD countdown sequence and analyze how it influences trading decisions. Here I'm going to be using the bullish TD countdown as a case study since I'm using recent candlesticks and I will also want you to see the result thereafter.
From the above chart, I have marked the area for the countdown with a rectangle. I took into consideration the bullish TD countdown. Before the countdown, I noticed a bullish TD setup which is always a downtrend movement implying that the asset is oversold and possible reversal may be made anytime soon.
After that the TD Countdown came out to confirm the strength of the trend and if there will be reversal or continuation of the trend. From my observation, immediately after the completion of the TD countdown, we saw a little move upward and then a little retracement before the final upward movement started.
I have used an arrow to indicate the result of the bullish TD countdown we got after the completion of the countdown. You can see a trend reversal to the opposite direction which is an upward direction as expected.
This means that this strategy is working very well if all rules are obeyed by the traders. I have seen from this practical approach though we saw a little pull back but in the end, the market still went the way we wanted it.
| Question 5: TD Sequential-Based Trading Strategies with Steem |
|---|
Theory: Describe a trading strategy that uses the TD Sequential Indicator to trade the STEEM/USDT pair. How could this strategy be optimized to maximize profits and minimize risks?
Based on the components of the TD Sequential Indicator indicator, which include the TD Setup and the TD countdown, these two can form the strategy needed to trade the STEEM/USDT pair. The major aim of the indicator is to know when the market will reverse so that a position can be exited and a new position should be entered.
Based on that, I will say the strategy needed is to first identify the TD setup completion, and then if there is a need you must also wait for the completion of the TD countdown. When that is done, you wait for a confirmation in other to be on the safer side then you go ahead and enter the market.
For the bullish TD setup and countdown after the completion, you must enter a long position because the completion of the Setup and countdown indicates the end of a downtrend. Similarly for the bearish TD setup and countdown after the completion, you must enter a short position because the completion of the Setup and countdown indicates the end of an uptrend.
Stop loss and take profit placement must be done according to the indicator as well. Your take profit should be the next resistance level for an uptrend and the next support level for a downtrend. Stop loss should be kept at the end of the current entry bar to minimize loss and maximize profit.
How could this strategy be optimized to maximize profits and minimize risks?
For this strategy to be optimized to maximize profits and minimize loss, you have to first ensure you combine it with other indicators such as moving average, RSI, volume indicator, and many more. This will help you spot fake signals and also help you to confirm the trend of the market and if the market has reached its overbought or oversold region.
The timeframe is also another thing that is needed to optimize this strategy. Higher timeframes are good as they can provide more reliable information to the trader whereas a low timeframe is mostly filled with noise leading traders to make some decisions that may later affect them. A short time frame is good for scalp traders.
Risk management which includes trailing stop loss could help you secure part of the profits and then you can also go out of the trade if the market begins to go against you knowing you have secured some profit from the beginning.
Always ensure that the trade you want to take meets the TD sequential Indicator rules that is it meets the TD Setup rules and the TD countdown rules. Also, no compromise should be made on this if the 9 consecutive candles didn't meet the criteria they should be abandoned and a new setup be made.
Practice: Implement this strategy on a demo account or trading simulator using recent historical data for STEEM. Present your results, including the number of winning/losing trades, and analyze the reasons for the strategy's performance.
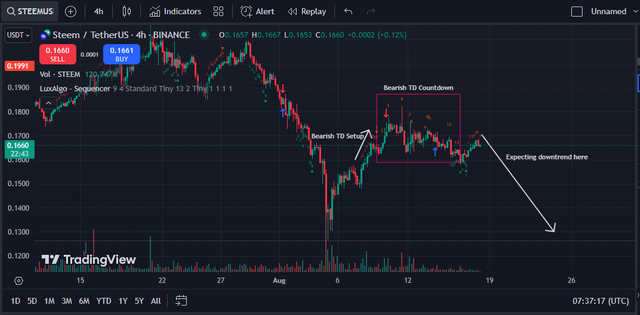
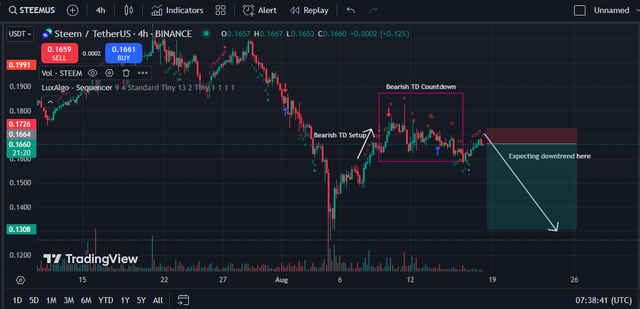
To enter this trade, I took a current chart of STEEMUSDT on a 4H timeframe as you can see from the screenshot below. Firstly I try to spot the TD Setup and the TD countdown and I have identified them from the below chart.
The above chart shows that we are having a bearish TD setup and a bearish TD countdown as the market is seen moving in an uptrend direction. With the appearance of the TD setup and the TD countdown, it is obvious that the market has been overextended hence a selling opportunity is what I should be looking for.
After the countdown, I saw a little upward movement again which is also expected and another bearish TD setup appeared so I'm certain that the market will go downward hence I decided to introduce my sell logo as seen in the screenshot below.
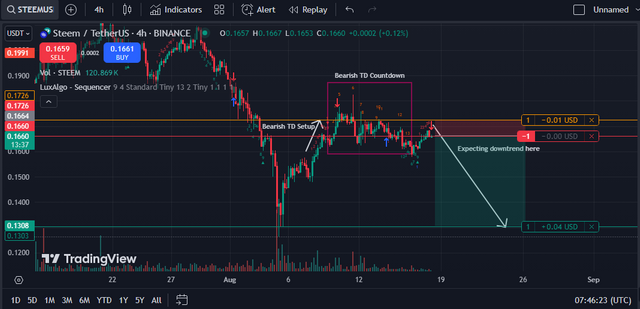
From the screenshot, I have marked my level of take profit to be the next support level and my stop loss just above the just concluded candlestick in case the market wants to go against my trade before coming in the predicted direction.
After that, I now placed a demo trade as you can see from the screenshot below. It shows the amount I will earn if the market goes in my favor and how much I will lose if it goes against me. The trade ratio is around 1:3 which is a good risk-reward ratio for any trade.
Also, the running trade screenshot is taken as seen below. It gives the details of the entire market. At the moment, no profit or loss has been made so I'm holding on to the trade and expecting profit based on my analysis.
Finally, I want to invite @suboohi, @patjewell, and @ripon0630 to also join the contest and share with us their thoughts on Trading Steem with the TD sequential Indicator.
Note: All images except otherwise stated are my properties and gotten from the TradingView website.


Thank you, friend!


I'm @steem.history, who is steem witness.
Thank you for witnessvoting for me.
please click it!
(Go to https://steemit.com/~witnesses and type fbslo at the bottom of the page)
The weight is reduced because of the lack of Voting Power. If you vote for me as a witness, you can get my little vote.
Downvoting a post can decrease pending rewards and make it less visible. Common reasons:
Submit
Upvoted! Thank you for supporting witness @jswit.
Downvoting a post can decrease pending rewards and make it less visible. Common reasons:
Submit
Upvoted. Thank You for sending some of your rewards to @null. It will make Steem stronger.
Downvoting a post can decrease pending rewards and make it less visible. Common reasons:
Submit
You shared very comprehensive and detailed information on TD sequential Indicator. This indicator is quite difficult to understand especiall for new traders, but the way you provide details on each section is really helpfull for all. Great work.
Downvoting a post can decrease pending rewards and make it less visible. Common reasons:
Submit
Thanks 🙏 boss
Downvoting a post can decrease pending rewards and make it less visible. Common reasons:
Submit
Wow! Brilliant!
I totally agree with what our fellow Steemian has stated: that you don't need to be an expert to understand your post.
The only thing is that a newbie to trading, like me, will have to read your post a couple of times as trading is tricky.
I do have one question. You mention that you set your timeframe for a one-day period. When do you use shorter periods, or do you use longer periods of timeframes with the one-day timeframe?
Downvoting a post can decrease pending rewards and make it less visible. Common reasons:
Submit
Short periods are mainly for scalp traders and this times can be 5 minute, 30 minutes or 45 minutes timeframe. Here you just enter the market and make your little profit and then opt out immediately. It is a risky form of trading as it generates a lot of noise or fake signals.
Downvoting a post can decrease pending rewards and make it less visible. Common reasons:
Submit
Umh.. too risky for my liking.
Thank you for anwering.
Downvoting a post can decrease pending rewards and make it less visible. Common reasons:
Submit
A nice and a comprehend approach towards the TD sequential indicator. I am liking your style if explaining about the developer before exploring the concepts of TD sequential indicator.
TD setup and TD Countdown bother have their own importance. Even they are part of a single indicator but both are different.
I think this is a good indicator to identify the reversal zones in the market. It also helps to identify the exhaustion of current trend.
Downvoting a post can decrease pending rewards and make it less visible. Common reasons:
Submit
TD Sequential is a trading model designed by Tom DeMark, a famous technical trader. It is a multifaceted system in which numerous technical analysis tools and graphical figures are used to search for modeling signals for buy and sell signals for changing trends. Your explanation is amazing. Best of luck to you. Thanks for sharing.
Downvoting a post can decrease pending rewards and make it less visible. Common reasons:
Submit