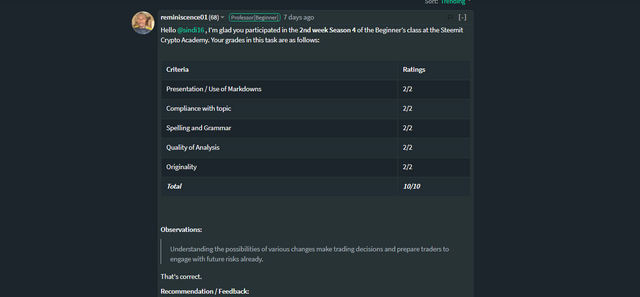
The review of my homework task that was given by prof. @reminiscence01. But this post was not curated and I will reposting my homework task post here.
.png)
This link to my original post
01.a.In your own words, explain Technical indicators and why it is a good technical analysis tool.
Technical indicators are data analyzing tools that are used in trading strategies. Indicators are used to indicate and predict the states of a market asset from time to time. Technical indicators use past trading patterns and circulations of price in their analysis processes. With indicators, traders can get an idea about the overall demand and the supply from time to time. The output of these analytical data is used to predict the future of a particular asset. Also, traders can identify the direction and the position of prices of the assets that they are interesting to trade.
Indicators carry out statistical information about market volume, trends and price fluctuations. This will help traders to understand and view the position of an asset in a market. Not only in cryptocurrencies but also any asset can be modified with the use of indicators to see where those are moving. Indicators are working with data of trading market fluctuations and bring out the possibilities of its future. Understanding the possibilities of various changes make trading decisions and prepare traders to engage with future risks already. This will help traders to gain a chance to earn more profits by leaving losses behind.

b. Are technical indicators good for cryptocurrency analysis? Explain your answer.
In cryptocurrency analysis, traders can rely on technical indicators to predict and review their future. Technical indicators themselves use past price swing signals to function mathematical processes in cryptocurrencies. This historical data helps traders to identify the long term positioning and trading replacements. In the currency market, indicators help to predict currency price movement, trade volume, buying and selling capacities and the satisfaction of demand. Also, technical indicators help traders to move with currency positively.

c. Illustrate how to add indicators on the chart and also how to configure them. (Screenshot needed).
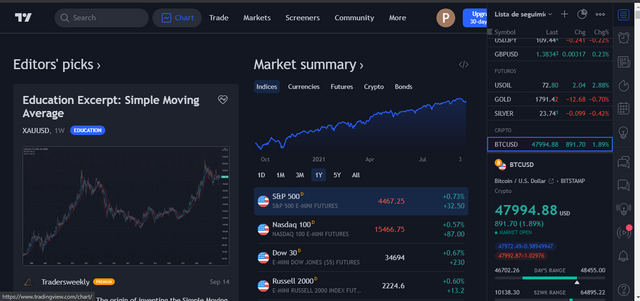
Step 1 - Go to Tradingview.com and select Chart.
.png)
screenshot
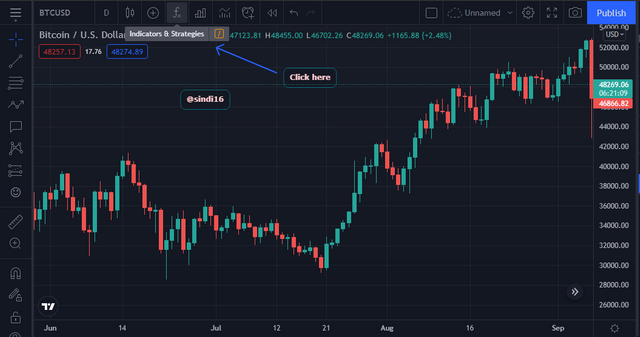
Step 2 - Then select Indicators and strategies.
.png)
screenshot
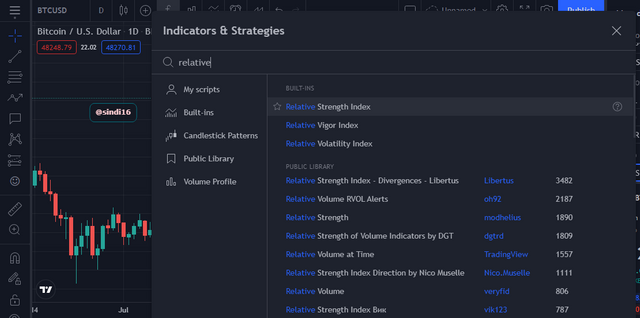
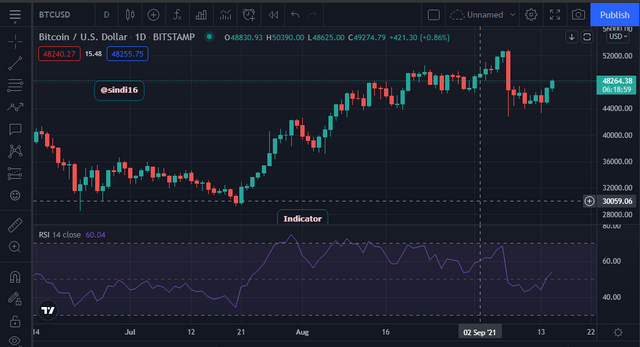
Step 3. - Select your indicator type by using the search bar. In my case, I used Relative Strength Index indicator.
.png)
screenshot
.png)
The indicator will appear below to the chart
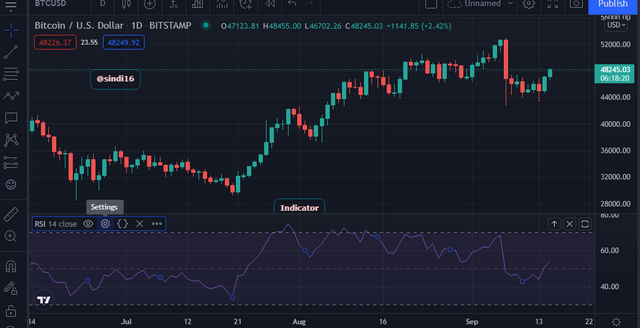
Step 4 - To configure the indicator, first click on the indicator. Then the tool box will prompt on the screen. After click on the settings icon in the tool box.
.png)
screenshot
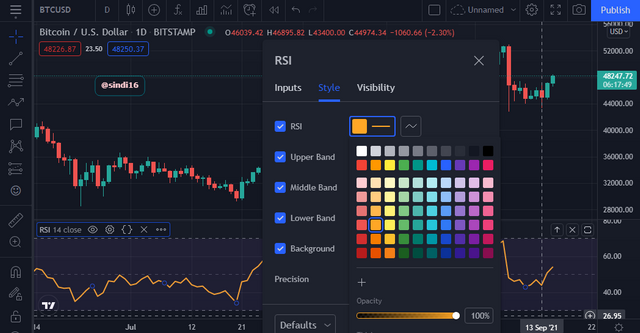
Step 5. - Using settings we can change colour and width of the line as we wish.
.png)
screenshot
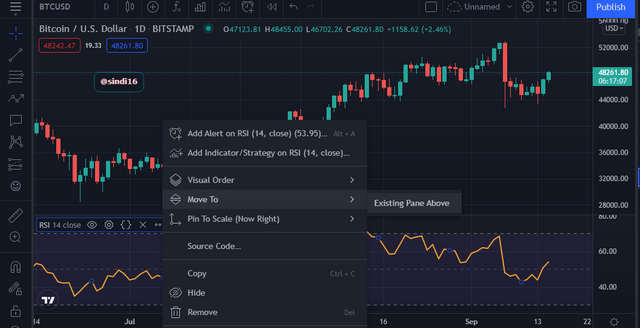
Step 6 - Further, we can change the plane of indicator by going more in the tool box. In my case, I have selected existing pane above. Then the indicator line will appear parallel to the chart.
.png)
screenshot
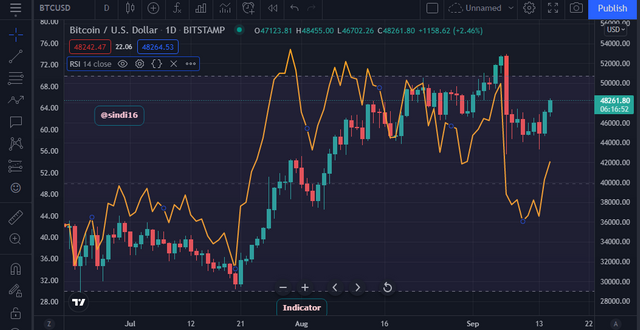.png)
screenshot

2.a.Explain the different categories of Technical indicators and give an example of each category. Also, show the indicators used as an example on your chart. (Screenshot needed).
Technical indicators used different types of data analysis to bring out its summary to its users. As there are several types of indicator categories, a trader should identify which is the best data analysis indicator according to the market. There are three main categories. They are, trend-based indicator, vitality based indicator and momentum-based indicator
Trend Based Indicator
Trend based indicators show the results of the market direction, whether it is an uptrend or a downtrend. The mean fluctuation value sires of highs and lows can be indicated using these indicators. If it is a downtrend or an uptrend, by using these indicators a trader can identify and predict the next movement of the market. Trend analysis may occupy with the seasonal changes of highs and lows of a particular trade market. These changing patterns make the mean distribution of overall market trends. If there is a bullish market, there may be lows. Inversely, if there is a bearish market, there may be highs. With the help of a trend based indicator, traders can identify the overall movement of the market at a certain period.
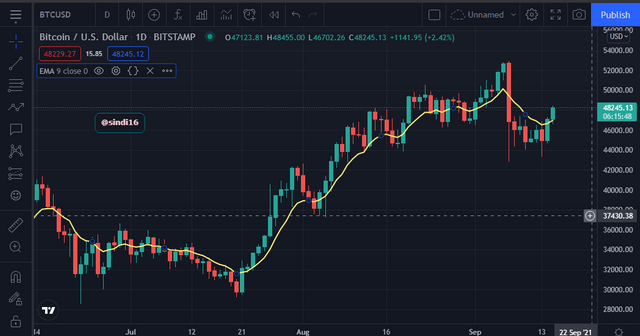.png)
Volatility Based Indicator
Volatility based indicators depend on the price of an asset in a market. These indicators use fluctuation of the price of an asset in a given period. Within a period, the price changings happen rapidly for an asset, the volatility of that market is high. If the price changings consume a considerable period, the volatility of that market is low. These volatility changing of assets represent the selling and buying activities of a market. By statistically analyzing these fluctuations, traders can interpret position and the direction of prices in future. These indicators help to manage the demand and supply of assets and provide opportunities for traders to buy at low prices and sell at high prices.
.png)
Momentum Based Indicator
With these indicators, traders can analyze the swings or the phases of a market price of an asset. These are engaging with the price marks of ups and downs. The degree and the magnitude of these prices are statistically brought out by this indicator. Therefore, traders can understand where the market will reverse and its strength of occupying in a market.
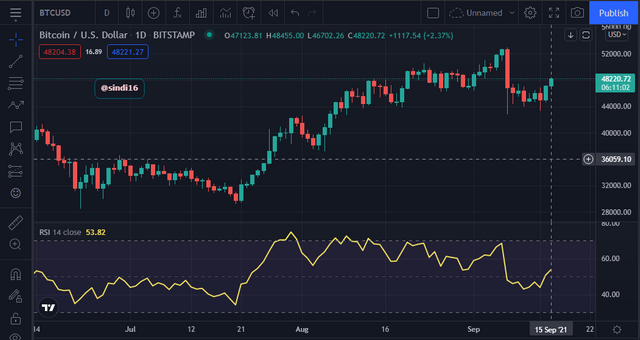.png)

b. Briefly explain the reason why indicators are not advisable to be used as a standalone tool for technical analysis.
Technical indicators use long term historical price marks to make trends and analyze the strengths of swings in a statistical way. The confirmation of statistical analysis is depending on the possible signals of trading market makes over time to time. In some cases, daily, weekly, monthly, annually and seasonal price fluctuating points may not give possible signals to calculate these trends and strengths for an asset. This lack of significant plus points for analysis will put traders into difficulties, without giving a clear prediction on assets of where to move. Therefore, the technical indicator tools have a risk to use standalone.

c. Explain how an investor can increase the success rate of a technical indicator signal.
To be a good investor, a person should have a crystal clear idea about how does market work and how assets are governed and influenced by sellers and buyers. Understanding of personal willingness of trading, demand and supply of a particular asset is also required. To have a success rate of trading, a trader should capable of having long term hands-on experiences, constant observations and patience. Other than that, the manipulation and the understanding of technical analysis tools will ease this process. But an investor should have the ability to select correct and favourable technical tools according to the nature of their trade. Also, an investor must have apt knowledge of how to deal with those applications in productive and efficient ways. And also, investors should understand the capacity and the limitation of these technical tools. Indicators and other technical tools always work with a bunch of data and they give the predictions according to their mathematical and statistical possibilities for future predictions. But the future is something unpredictable and unexpected gift that can happen anytime. Hence, investors should keep in mind that there is some per cent of risk in predicting the future. Therefore, an investor should try to do experiments on their own to gain self-experiences with the back of these indicators to have success in trading.

CC - @reminiscence01