

Question(1)
Define and Explain in detail in your own words, what is the EMA Strategy + Trend Line Breaking?
Before I dive into explaining what the EMA strategy is, I would want to have a recap of other treminologies I had learnt earlier in relation to this topic.
- Price action
This is the movement or change in the direction of price over a period. The technique involves the use of only price movement without the interference of fundamental data.
- Moving Average
The Moving Average is an indicator that calculates the average price of an asset over a period, the effect, is to smooth out the effect of price changes or behaviour in the market. The two major Moving Averages used by traders include, the SMA(Simple Moving Average) and the EMA(Exponential Moving Average).
- What is the EMA indicator
This is a lagging technical indicator, which is also a type of Moving Average, that tends to smooth out the effect of recent price action over a period, this also means that it will react quickly to the recent movement or behaviour of an assets price. Traders use this indicator to verify the direction price will take, to confirm entry points and also confirm how strong a market trend is.
The EMA is used by both short and long term traders, but the most preferable setting for short traders is the 12-day and 26-day EMAs, while for long term traders the most preferable setting is the 50-, 100- and 200-day periods.
- How to add and Modify the EMA on a chart
To add the EMA, first, choose any charting platform of your choice, in this illustration I will be using the Trading View.
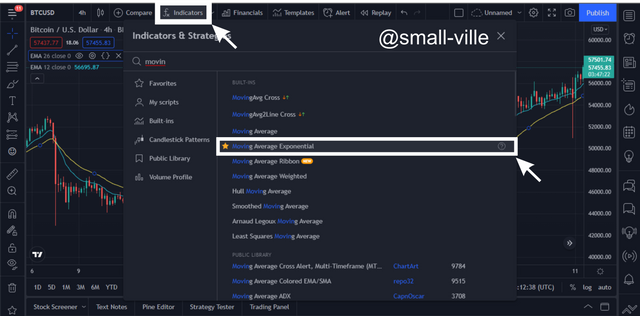 Image edited on Coreldraw. Image source
- Step 1
Click on the indicator icon, this will pop out an infobox that will give you an alphabetical list of all the indicators. - Step 2
Search for the EMA and click on it, it will automatically appear over the chart.
 Image edited on Coreldraw. Image source
The above image is the 12 and 26 EMA over the BTC?USDT chart.
Step 1
Double click on any of the EMA lines, this will bring a popup info box.
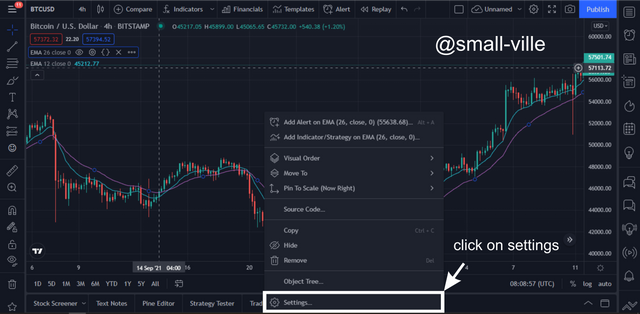 Image edited on Coreldraw. Image source
Step 2
Click on settings, this will bring up an infobox that contains 3 tabs that serve as an option for the various modification of the EMA.
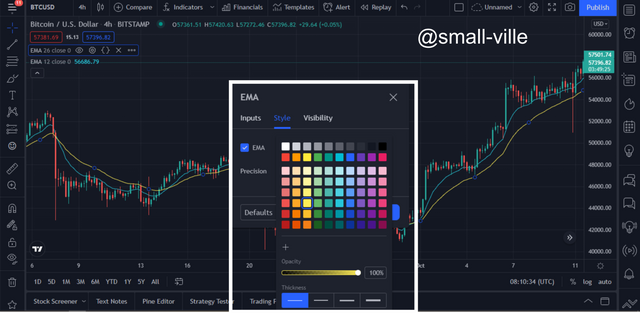 Image edited on Coreldraw. Image source
Step 3
Click on the Style tab and click on the colour palette to choose the desired colour for easy identification of the EMA line.
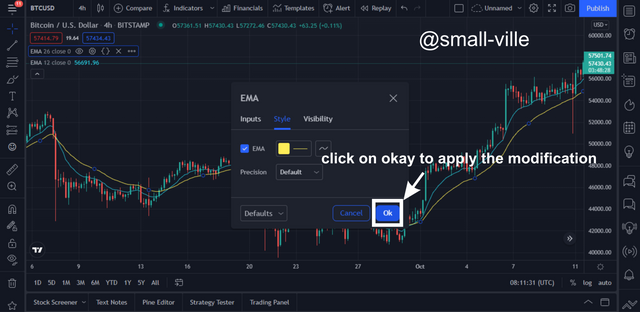 Image edited on Coreldraw. Image source
Step 4
Click on the OK to apply the changes or modifications done to the EMA line.
EMA Strategy
The EMA strategy is not so different from other strategies that are used for other Moving Averages, but I will give a detailed view of some EMA strategies below. But note; that to use the EMA alone, you should at least combine it with another Shorter or a Longer period of the EMA, by doing so you will have more successful outcomes or predictions.
Verification of Market Trend
To use the EMA you have to verify the market trend by using a longer period of the EMA, for example, the 100 EMA, this can be done by modifying the Period using the settings.
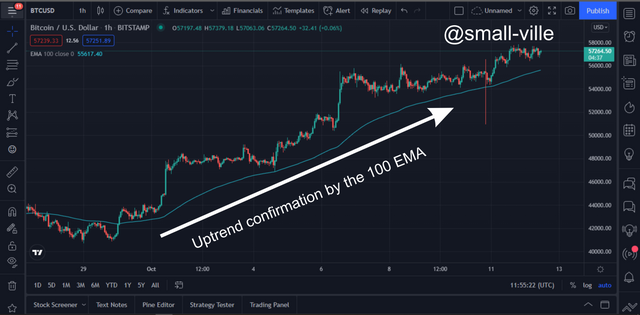 Image edited on Coreldraw. Image source
Breakout Confirmation
The EMA is used to confirm a breakout of the price of an asset. Breakout is a situation where the price has been able to cross a strong resistance level or line.The Golden Cross identification
The Golden cross signal or Breakout is the situation where a lesser period of the EMA, for example, the 50EMA crosses above a longer period of the EMA, for example, 200EMA, this signal indicates that a Bullish cycle is about to begin.
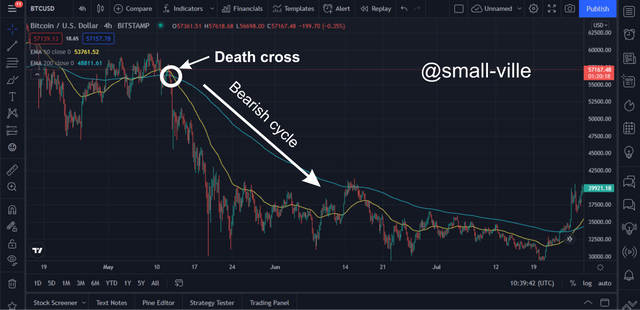 Image edited on Coreldraw. Image source
The Death Cross identification
The Death cross or the sell signal is a situation where a shorter period of the EMA crosses below a longer period of the EMA. For example, if the 50 EMA crosses below the 200EMA, this indicates that a potential bearish cycle is about to begin.
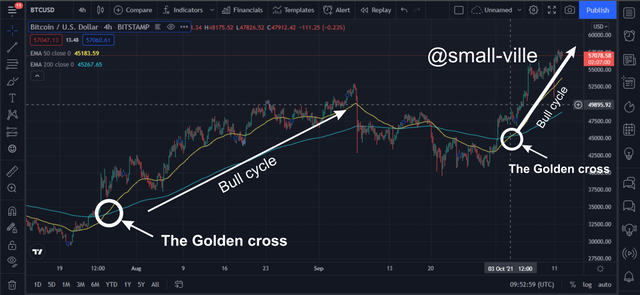 Image edited on Coreldraw. Image source
What is a Trend Line
Before I explain what a Trend line is, I will first explain what a Market Trend is. A Market Trend is the general movement of the market, it goes mostly in 3 directions which include Bearish or down Trend, Bullish or Uptrend and Sideways Trend.
- What is a Trend Line
A Trend Line is the most used Technical tool, which is used to identify the trend of a market, it is used by all types of Traders(Scalpers, Swing and Position traders) regardless of the Time Frame. The Trend line is the joining of the major and minor swing points of price to identify the major trend in the market.
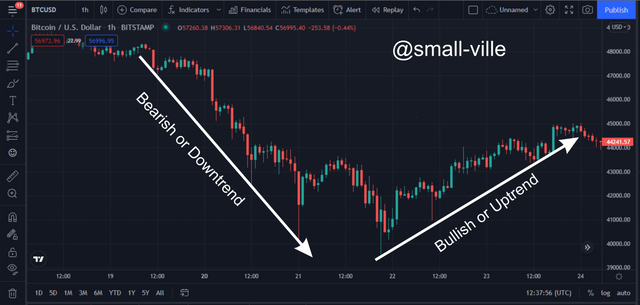 Image edited on Coreldraw. Image source
- What is the Trend Line Breaking
Trend line Breaking is a Trend line trading strategy whereby a trader places a trend line on the major and minor wing points of a pullback and then waits for the price to break over the trend line before making an entry. This strategy is used to minimise losses in case of a drawback in price after making an entry, but this strategy can be risky because sometimes the pullback might go on to form a bearish trend.
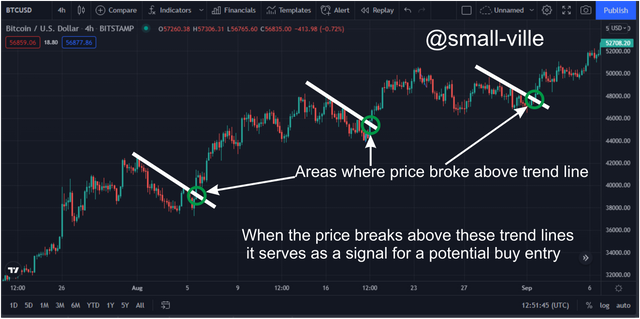 Image edited on Coreldraw. Image source
 - The EMA Strategy + Trend Line Breaking
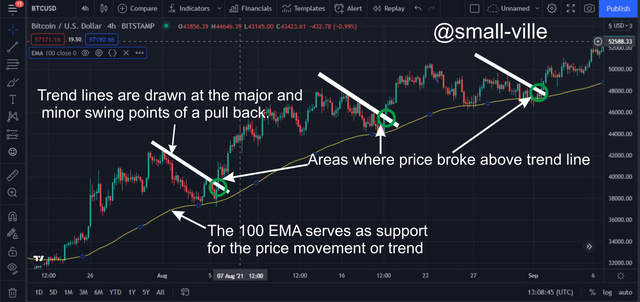 Image edited on Coreldraw. Image source
From the image above, the market trend is verified by the 100 EMA because it is clear that price is moving above it, then to look for entry points draw a line at the major and minor swing points of a pullback and wait for the price to break through before making an Entry.
Question(2)
Explain in detail the role of the 100-period EMA in the EMA Strategy + Trend Line Breaking?
Before starting or making a purchase of an asset in the market, you have to first identify the Trend. This is of the essence so as not to trade against the trend, and in doing so accumulate losses.
The 100-EMA is the ideal setting that is used to determine the market trend, because not only does it serve as a support for the price, it also verifies how strong that trend is.
- The 100-EMA on a Bullish Trend
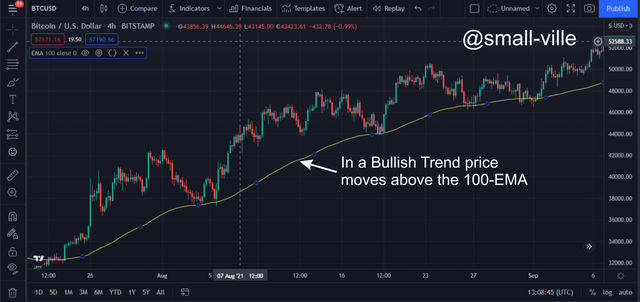 Image edited on Coreldraw. Image source
When the price moves above the 100-EMA, it identifies and verifies that the Bullish or Uptrend trend is strong.
- The 100-EMA on a Bearish Trend
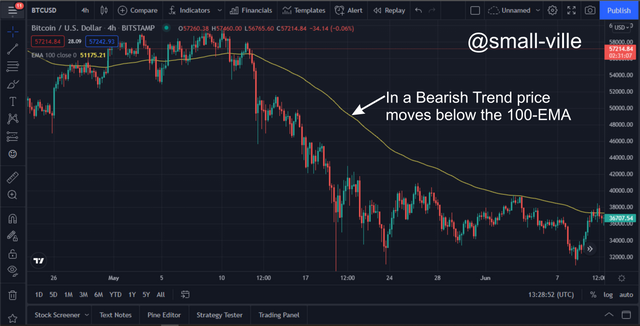
When the price moves below the 100-EMA, it identifies and verifies that the Bearish or Downtrend is strong.
Question(3)
Explain in detail the function of the "Trend Line" in the EMA Strategy + Trend Line Breakout?
The EMA Strategy + Trend Line Breakout is used to determine the trend of the market and also identification of entry points, but before a Breakout is to occur, the price needs to cross over the resistance line. The resistance line is a line used to mark similar areas where price have been rejected or was not able to cross over a period.
The Trend line serves as a resistance to price, therefore should Price break or cross over the trend line, it means or serves as a confirmation for the direction of price, with this a trader can place his or her trade.
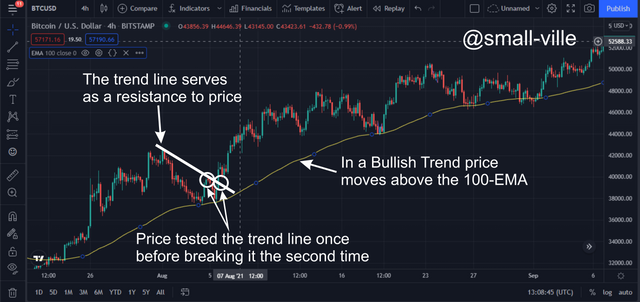 Image edited on Coreldraw. Image source
The image above shows a situation where the combination of the 100-EMA and the Price trend line Breakout technique was applied. It can be seen that price was not able to cross over the trend line which serves as the resistance at the first test, but was able to break it the second time.
This means that the Trend line also serves as a check to the movement of price because if the price was not able to cross the Trend line it could mean that the drawback could continue, but if it continued till it crosses the 100-EMA, then it shows that the major trend line is getting weak and change in direction of trend could be imminent.
Question(4)
Explain the step-by-step of what needs to be taken into account to execute the EMA + Trendline Breakout strategy correctly?
- Identification of a Trend
Before the execution of this strategy, the trader needs to identify a dominant trend by adding the 100-EMA. The 100-EMA serves as a support to price, also it is used to identify trends depending on if they move below or above the 100-EMA. When price moves above the 100-EMA it means that the dominant trend in the market is in a UP or Bullish trend, while if the price moves below the 100-EMA it means that the dominant trend in the market is the down or Bearish Trend.
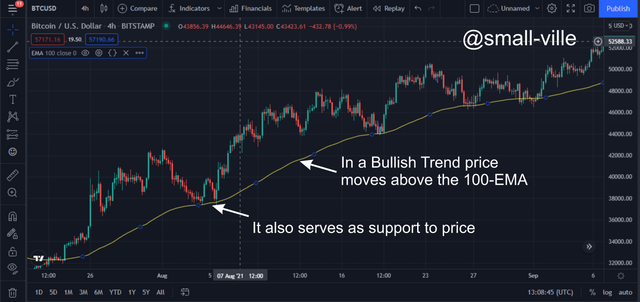 Image edited on Coreldraw. Image source
- Identify a Market or Price Structure
The EMA + Trendline Breakout strategy makes use of drawbacks which means that a price structure must be used to help identify drawbacks or retracements in the market, these drawbacks or retracements will serve as areas of resistance where the trend line will be placed.
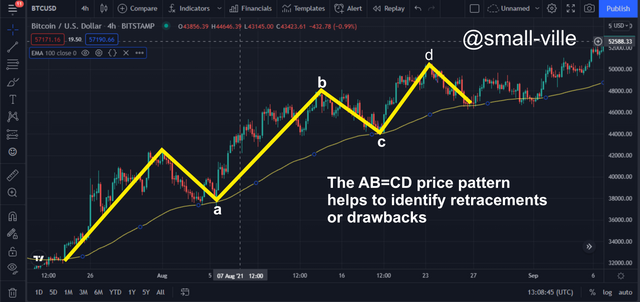 Image edited on Coreldraw. Image source
- Placement of the Trend Lines
The Trend lines which serves as resistance to the movement of the price should be placed in a counter direction of the dominant trend. The Trend Line should be placed on the drawback or price retracement so that it can serve as a resistance to Price.
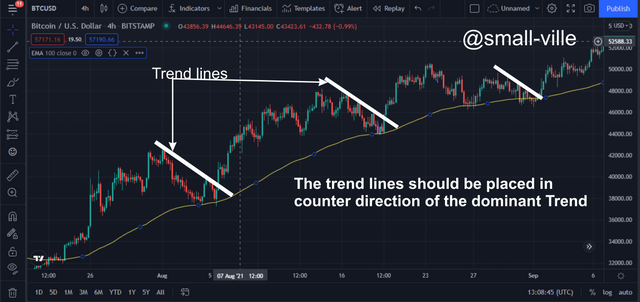 Image edited on Coreldraw. Image source
Question(4)
What are the trading entry and exit criteria of the EMA strategy + Trend Line Breaking?
To make an entry or exit into the market using the EMA strategy + Trend Line Breaking, there are some criteria you need to put in place to have a successful entry or exit.
The first criteria to be aware of is the market or price trend, make sure that you identify a dominant trend, this could be identified by using the 100-EMA. when the 100-EMA moves above the price it is deemed that the Bearish trend is dominant, also if it moves below it suggests that a Bullish trend is dominant.
With the identification of a trend, the next criteria to identify is the market or price structure, which is identified when price makes highs and lows in either direction of a trend. with the identification of a healthy market structure, the trader can significantly identify areas of interest in regards to the trade the trader wants to execute.
The trend line which is placed in a counter direction to the dominant trend should be broken or crossed by the price action before making an entry when the next candle emerges, if the price is not able to break or cross the trend line, the trader should wait until it does, but if it eventually does not then the trader should look for another area of interest.
When the price breaks or crosses the trend line the trader can now make an entry on either side of the trend in use but should set the take profit and stop loss at a ratio of 1:2 as a risk management technique. with the ratio set at 1:2, the trader can be able to gain a double percentage in profit, but for beginners or traders with small accounts, a ratio of 1:1 is ideal to prevent a failed trade.
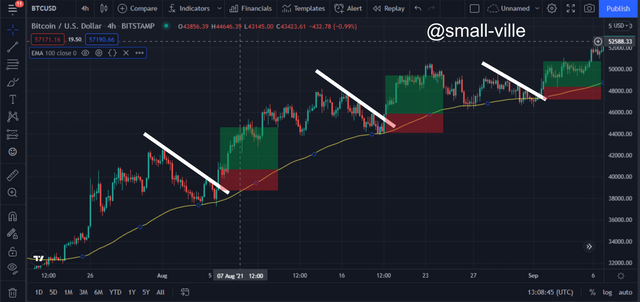 Image edited on Coreldraw. Image source
 Image edited on Coreldraw. Image source
Question(6)
Practice (Only Use of own images)Make 2 entries (One Bullish and one Bearish) in any pair of "Cryptocurrencies" using the "EMA Strategy + Trend Line Break" (Use a Demo account, to be able to make your entry in real-time in any temporality of your choice, preferably low temporalities)
- Bearish Entry
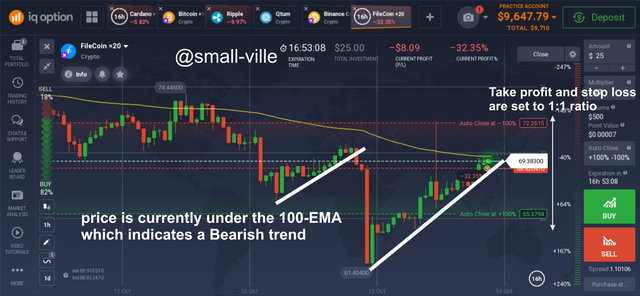 Image edited on Coreldraw. Image source
The image above shows an expected trade on the FIL/USD chart. Before I executed the trade, I made sure I identified the dominant trend using the 100-EMA, which was Bearish. Then I went on to identify a structure with which I placed my trend line on the retracement, which will serve as a resistance to price and once it broke it, I placed made an entry. I then applied risk management procedures by setting my stop loss and take profit at a ratio of 1:1.
- Bullish Entry
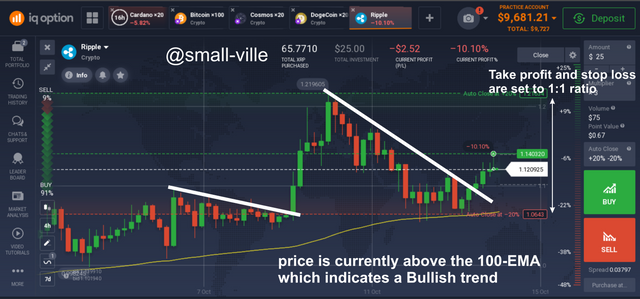 Image edited on Coreldraw. Image source
The image above is the XRP/USD chart. It shows that the XRP price is on a Bullish trend because the price is currently moving above the 100-EMA, then I went on to place my trend line in a counter position of the dominant trend, to serve as a resistance to the price during a pullback or retracement, once price broke above it I then executed the trade, with my stop loss and take profit at a ratio of 1:1.
Conclusion
The EMA is one of the best and most used lagging indicators, because of its ability to emphasize the recent price action data. Trend line Breaking strategy is a situation where the trend line is placed in a counter direction to the dominant trend. It is a very productive strategy that helps to prevent unnecessary losses due to retracements, or sudden changes in the direction of price movement. The combination of the EMA and the Trend line Breaking strategy is very productive, but it is also of the essence to use a combination of higher and lower periods of the EMA while trading to achieve better results.