
Question (1)
what is Harmonic Trading?
Harmonic Trading is the use of Hamonic Trading patterns to predict the price action of the market. These Harmonic patterns are created when there are repetitions of price movements in the market, they include Triangle, Heads and shoulders Movements, but sometimes even when these patterns are identified they might not correspond with the Fibonacci ratios, this means that to identify Harmonic pattern patience is key because the trader has to have an objectified view of the patterns which are based on the Fibonacci retracements and extensions to find the right movements in the market.
What is the Fibonacci Retracement
The Fibonacci Retracement/Extention is a Technical Indicator that is used to determine the potential price movements of the market. The Fibonacci numbers were created by an Italian Mathematician named Fibonacci, by adding the previous two number which begins with 0 and 1 e.g 0+1=1, 1+1=2, 2+1=3, 3+2=5, 5+3= 7, the sequence continues this way.
The Golden ratio is a familiar term used in Fibonacci, which states that any given number is more or less 1.618 multiplied by the former number and 0.618 multiplied by the number in front.
This ratio is said to be ever-present in all aspects of life including the financial market.

Question (2)
Define and explain what the AB=CD pattern is and how can we identify it?
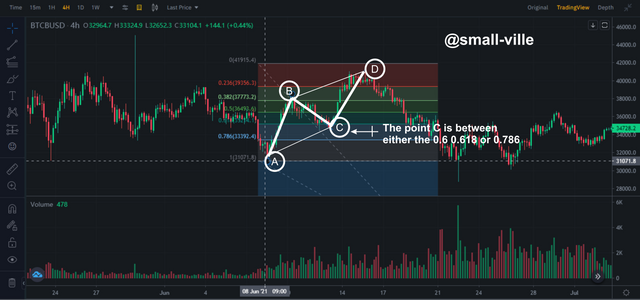
The AB=CD pattern comprises of three movement patterns which include AB, BC and CD in both Bearish or Bullish directions. The AB=CD is a Harmonic pattern that helps traders identify a price reversal in the market trend. The PRZ or the Potential Reversal Zone is a term used by traders to mark their area of entry or exit on the AB=CD pattern which could mostly be identified at the C Retracement zones or the D areas where the patterns are completed.
- Identification of the AB=CD pattern
To identify the AB=CD pattern the There must be a repetition of price movement from point A to point D, starting with a continuous trend from A to B, before a reversal in price action/movement from point B to point C regardless of the market trend, then another movement of C to D which is a similar repetition of the line A-B. When these points have been identified, they should then be backed up by the Fibonacci Retracement/Extention, with the C point either at the 0.618 or 0.786 ratios and the BC projections at either 1.27 or 1.618 ratios of the Fibonacci levels.

Question (3)
Can you clearly describe the entry and exit criteria for both buying and selling using the AB=CD pattern?
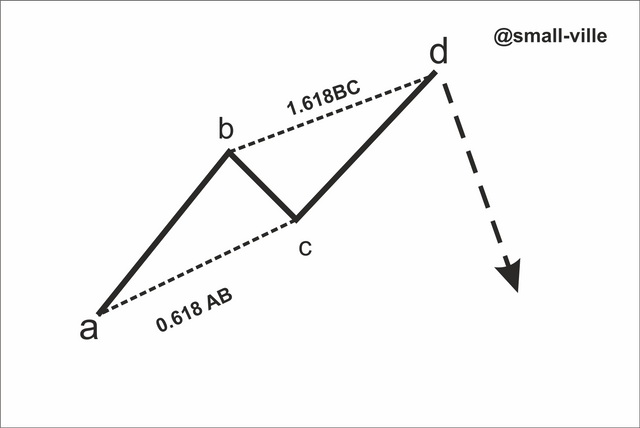
When there has been a repetition of line A to B from point C with BC being the correction or retracement and CD being the repeated pattern, then your entry point should be Point D.
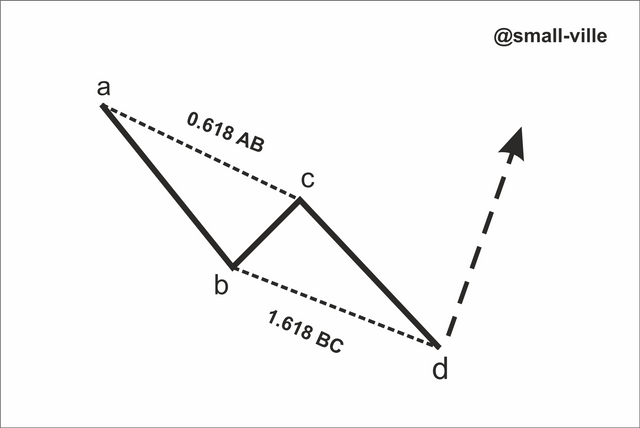
For an exit signal, Point C should serve as the exit point because it is a potential retracement point for a harmonic pattern. This pattern is also applicable for a bearish and bullish trend.

Question (4)
Practice (Only Use of own images)Make 2 entries (Up and Down) on any cryptocurrency pair using the AB=CD pattern confirming it with Fibonacci.
- Entry point for up Trend
source
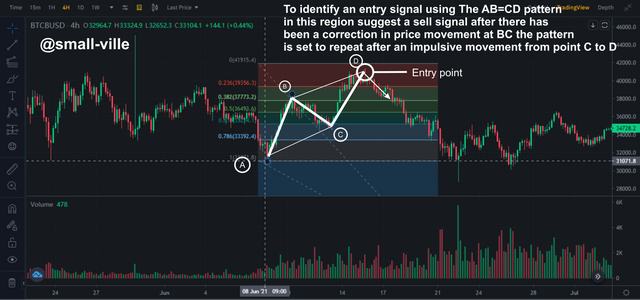
From the above image it could be seen that I was trading on the BTC/BUSD on the 4hr chart, for the entry point to be identified I had to make sure that there was a repeated pattern of line AB at CD, I also had to check if the Fibonacci ratios were in place of correlation to the points. with these facts in mind I was certain that an entry point should have been made at point D
- Entry point for DownTrend
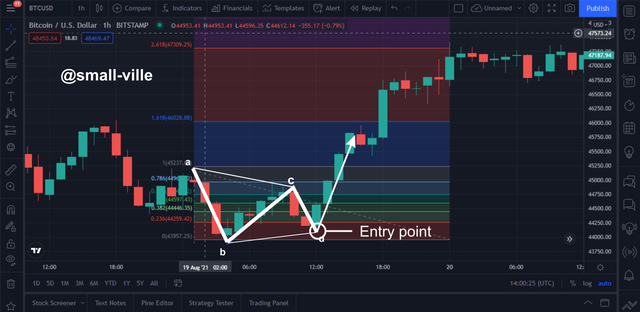
source
After I identified the AB=CD pattern I cross-checked if it corresponded with the Fibonacci ratios before I have certified that point D was a perfect choice of entry.

Conclusion
The harmonic Trading pattern is a very useful trading strategy that will help traders identify points of entry and exit. The AB=CD pattern is an easy pattern to identify, but users should always make sure that the patterns correspond with the correct Fibonacci ratios before making major calls on the market price action.
Thank you Professor @lenonmc21 for this wonderful lecture.

