
Question 1
Can you define in your own words what Price Action is?
Every asset in the market has a price, which means that the asset can be traded through buying and selling, these transactions that go on within this asset's market affect the increase and decrease in its price due to Supply and Demand.
The Price action is a visual representation of the increase and decrease in the price of an asset in the market. It can be represented as Candlesticks, Line and Bar charts. Price action Strategy is the act of using the historical movement of price in the market to predict its future action/movement. This means that traders do not focus on the use of other Technical or Fundamental Indicators to analyse or predict price movements, This could also be called Naked Trading.
The Price action strategy is commonly used by swing or day traders to predict the movement of price by looking for quick breakouts at favourable positions based on the previous movement of price. Nevertheless, it is ideal to take note that all indicators are derived through the price action but, it is still needful to use them with the price action strategy to achieve a successful outcome.

Question 2
Define and explain in detail what the "Break-Even Point" is with at least one example of it (Use only own charts?
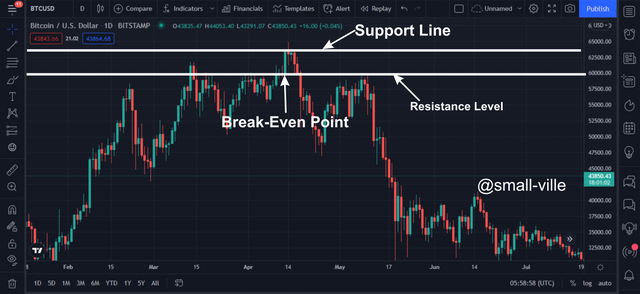
This is the last Movement a candle makes in a particular trend, this is the region where the loss and profit of a trader are of equal value. This means that the last impulse of the bullish trend or bearish trend is of equal value.
source
From the image above we can see the last impulse or movement of the candle in the Bullish trend of the BTC/USDT. That last Bullish candle ended the Bullish trend before there was a retracement back to the resistance level.

Question 3
Can you clearly describe the step-by-step to run a Price Action analysis with the "Break-Even Point"?
- First Step
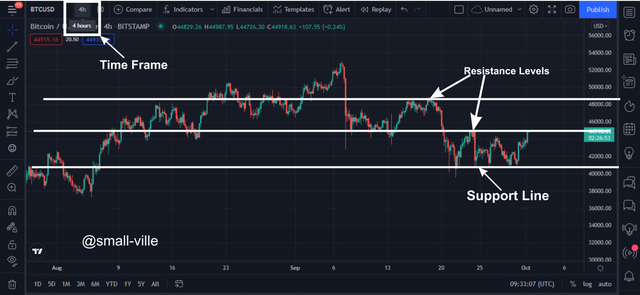
Enter a chart view of any analysis platform of choice, then choose a time frame of your choice based on the type of trader that you are, example as a Day or Swing trader you can choose from the 1-4 hour Time Frame or as a scalper you can choose a 15-1 minute time frame. this will help the trader to spot areas of interest on the chart.
- Second Step
Identify points or areas of interest which include, Support and Resistance Levels, this will help the trader know when the price has reached its areas of rejection. These areas can be identified using horizontal lines. these areas will help the trader mark entry and exit points of his trade.
- Third Step
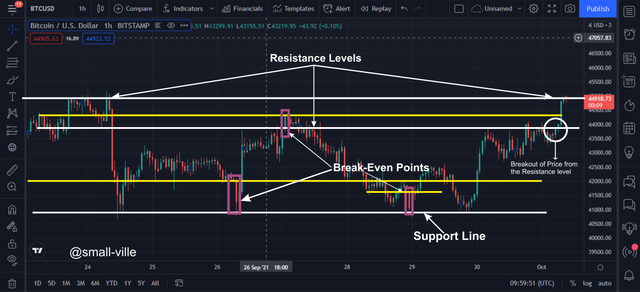
After the Support and Resistance levels have been identified, the next areas to spot are the Break-Even Points, this will help the trader to identify entry and exit points for the trade, also the trend of the market should be of importance so that the trader will not trade against it.

Question 4
What are the Entry and Exit criteria using the Equilibrium Point Price Action technique?
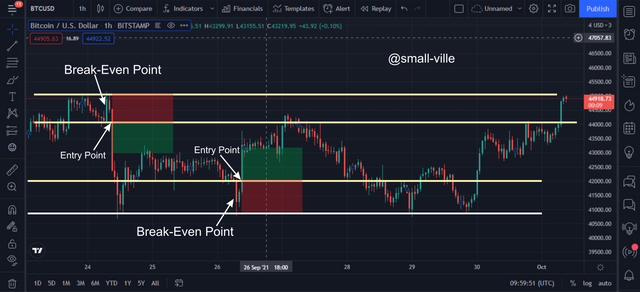
The resistance and support levels of the price history could serve as entry and exit points for a trade.
source
To identify entry and exit points, the trader should first mark the support and resistance levels, then use them to find the point of equilibrium or Break-even points.
When these points are identified the trader should then mark the begging of the Break-even candle as the entry point. From this point, the trader should use the length of the candle as his primary ratio for a take profit and a stop loss, which would be a 1:1 ratio thereby limiting losses in case the price goes against the analysis.

Question 5
What type of analysis is more effective the action of the Price or the use of technical indicators?
Price action is the use of historical price movements to predicts is future directions, this means that the trader will use original data of price movements to verify predictive movements of the price. Technical indicators are simply derived from the price actions which means it will project diluted Analysis of price.
I Think that Price Action is more effective to use than the Technical indicators because Technical indicators sometimes produce false or dull signals due to they having individual attributes that were generated based on price action. Technical indicators are also prone to deceive readers who are a novice in trading because of their complex interface. Price action provides undiluted results of price movement based on the trading activities going on in the assets market.

Question 5
Practice (Only Use of own images) Make 1 entry into any cryptocurrency pair using the Price Action Technique with the "Break-Even Point" (Use a Demo account, to be able to make your entry in real-time at any time of your choice)
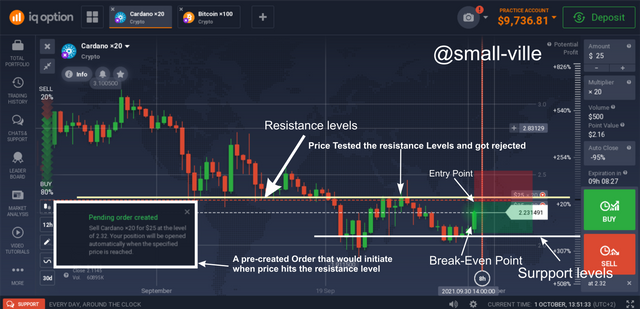
From the Image above I spotted the areas of resistance using horizontal lines. The price of Cardano which was at $2.23 was making a major move towards the resistance line where the price was previously rejected at $2.32. The Break-even Point is the current candle which currently is going bullish, therefore I place a Sell pre- order at $2.32 because the price will equally be rejected at that level too. I will also set my stop loss and take profit at an equivalent length of the Break-even point candle.

Conclusion
Price action Strategy is the process of using historical price action to predict the future movement of the price at a given period. Break-even Strategy is a price action process that involves using the support and resistance levels to spot the Break-even point which could be used to mark entry and exit points of a trade, it could also be used to set stop loss for trades. The price action is also an undiluted illustration of trades that go on in the market while technical indicators are derived from price action, that is why they are less effective than the price action analysis because they are derived from price action activities.
Thank you Professor @lenonmc21 for this amazing lecture.
