Hey there my fellow steemians, today we will talk about VWAP, a course from our wonderful professor @lenonmc21, strap in as we dive in.
- Explain and define in your own words what the “VWAP” indicator is and how it is calculated (Nothing taken from the internet)?
- Explain in your own words how the “Strategy with the VWAP indicator should be applied correctly (Show at least 2 examples of possible inputs with the indicator, only your own charts)?
- Explain in detail the trade entry and exit criteria to take into account to correctly apply the strategy with the VWAP indicator?
- Make 2 entries (One bullish and one bearish), using the strategy with the “VWAP” indicator. These entries must be made in a demo account, keep in mind that it is not enough just to place the images of the entry, you must place additional images to observe their development in order to be correctly evaluated.
What are Technical Analysis Indicators in Trading?
Technical Analysis is a strategy a trager uses to examine an investment chart in order to tell it's future performance. Some investors may use Technical Analysis to show where to enter or exit a stock position. These terms like trend, Support & resistance, price patterns and technical analysis are used for technical analysis.
- TREND:
This is the direction a stock's price is moving. They may be classified as Up, Down and Sideways. It is important to traders because it is belived price will continue to progress in the same direction it's been going.
- Support & Resistance:
They basically give signals to enter or exit a trade. If a stock breaks through resistance it is seen as though it would continue to rise, if the stock falls below the support area, it is considered as a good time to exit.
- Price Patterns:
The price patterns may build on support or resistance They are basically shapes use for support and resistance. They include these shapes like Triangle, Flag, Head and shoulders and Triple tobe.
The aim of using indicators is to see a perspective on how the price would move, it is important to consider the time frame because it affects the usefulness of the indicator.
There are many indicators out there when it comes to trading but when we examine an indicator we look for these key features; momentum eg: MACD, RSI and ADX, & Overbought eg: Fibonacci retracement, Bollinger Bands and Stochastics Oscillator. Some indicators may be classified under both which are either Momentum or Overbought.
A trading indicator can be used to define a trend, it may be is used to show areas of value, and it helps to time your entry (Entry Trigger).
Some terms that may mentioned above, defined
- Stochastic indicator:
It was developed In 1950's by Dr.George Lane, they give indicators for when the market is Overbought or oversold, it compares current price with previous prices. It takes into consideration of the highest height of price and lowest low of price. It is bounded between 0 to 100.
- Fibonacci retracement:
This is may be seen as a line where support and resistance may occur. The Fibonacci retracement founded in the 13th Century. The percentage is dependent on the set range of 50% and 61.8%.
- Bollinger Bands:
It was first originated by John Bollinger in the 1980's. They are used to show the maximum and minimum moving average of the price. The Bollinger determines if price is high or low. There are also some indicators of Bollinger Bands, they include BBImpulse, %b.
Leading Indicators
Lagging indicators
LAGGING INDICATORS:
They often use a longer period than leading Indicators. It is basically used for trend determination. They help to look back historical performance and focus on outcomes. Lagging indicators are used to confirm price action, for instance in a live chart, they are likely to confirm the trend direction and how strong it is, they also help to confirm a reversal in price direction.
Examples of Lagging Indicators include,
- Moving Average
- Bollinger Bands
LEADING INDICATORS:
They often try to predict price using a short period in calculation. It is used for short entries. The leading Indicators give signals before a change happens, they are used to identify possible trend reversal. The leading indicator is also prone to false signals, which could attract losses. When price attains an overbought level, it signals a reversal, and when an oversold level is reached it also signals a price reversal. They give signals before an event actually occurs, they can't be used solely but must be used in combination with other indicators.
Examples of leading Indicators include;
- Relative Strength Index (RSI)
- The Stochastics Oscillator.
.

Q1. Explain and define in your own words what the “VWAP” indicator is and how it is calculated (Nothing taken from the internet)?

VWAP is short for Volume weighted Average Price, the goal is to reflect the bullish sentiment when price is above the VWAP and bearish when price is below the VWAP. VWAP is most utilized in short timeframes, to a layman it may just look like buying above VWAP and selling at a point above the VWAP but it holds more complex than ordinary buying and selling.
VWAP is used as a benchmark for trading, traders would like to form a support when price is below the VWAP than when price is above it. There are also some limitations to VWAP, it cannot be used to tell the direction of a trend, and it can only be used short or medium timeframes.
VWAP is calculated by the sum of price added to volume of trade in that period and divided by number of candles per day. This is indicated is only used for 1M,5M,10M, 1H, 4H but it must be within a day. Let's take for instance we are considering a first candle for a 5 minute chart, we would take the High price, low price and closing price into consideration.
Total Price Volume= HP + LP + CP
VWAP = (Total Price Volume + Volume of trade) / Number of Candles per day.
Then, we would find the average of the total price for the first candle with this we would use to multiply with the cumulative volume to get the total price volume (Total Price Volume) then we use this value to then divide by the cumulative volume. For a particular day the VWAP is calculated by dividing the sum of all the TPV from all the other candles by the cumulative volume, the TPV is calculated individually for each candle to get the current VWAP.

Q2.Explain in your own words how the “Strategy with the VWAP indicator should be applied correctly (Show at least 2 examples of possible inputs with the indicator, only own charts)?

Firstly before we apply VWAP Strategy we must first of all take note of Fibonacci retracement tool & market structure, then we also apply the indicator on our chart, it is a simple step by step process all you need do is,
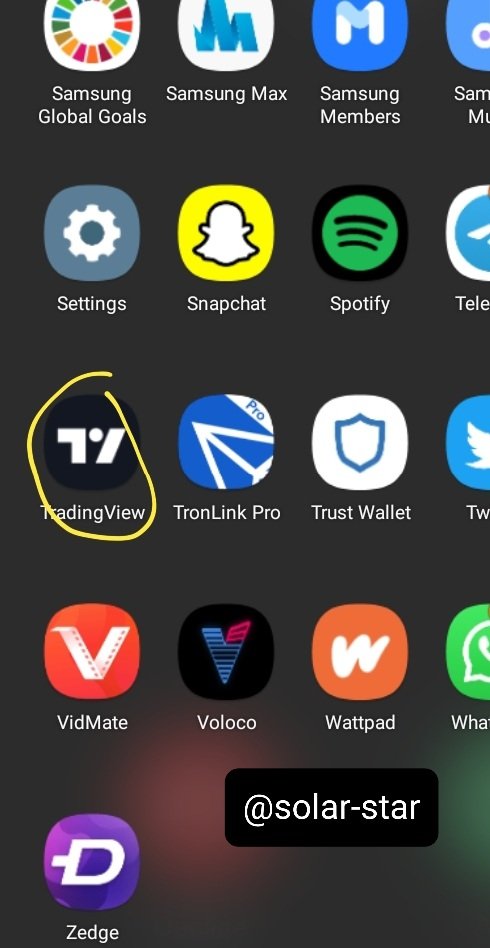
- Open the trading view app or you may visit their site at www.tradingview.com
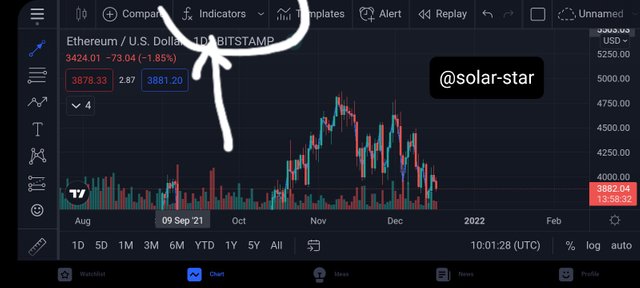
- At the top of your screen click on indicators
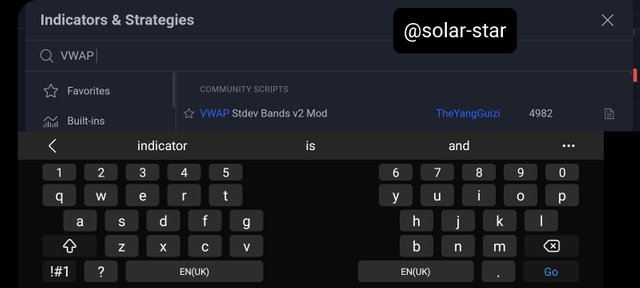
- Search the word "VWAP " on the search bar that appears.
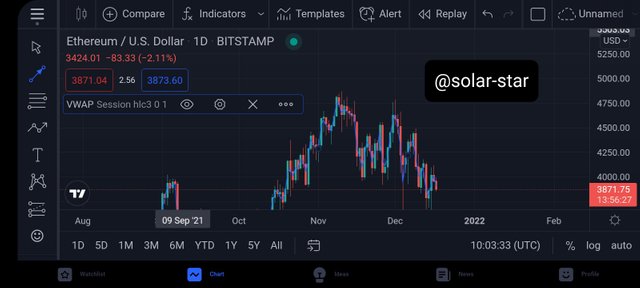
- The Indicator would appear as seen below
- Click on setting as seen below

- A menu will appear showing headings displaying inputs, style and visibility.
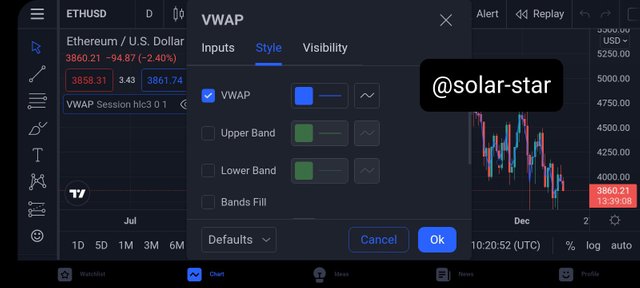
- Click on the style heading then go ahead to increase the intensity of the line and also unclick the boxes showing Upper and lower bands.
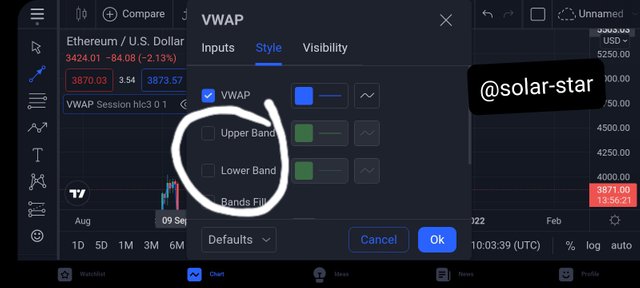
- Click on ok and proceed to view your chart.

- Firstly we consider the Bullish and Bearish
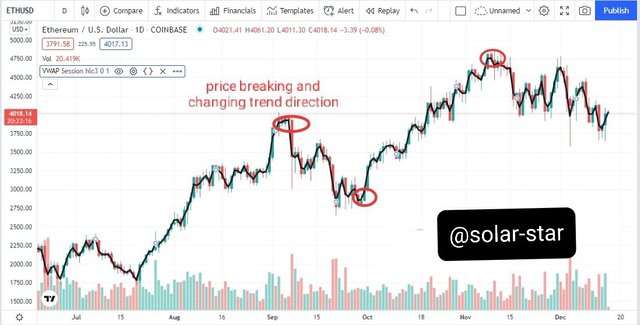
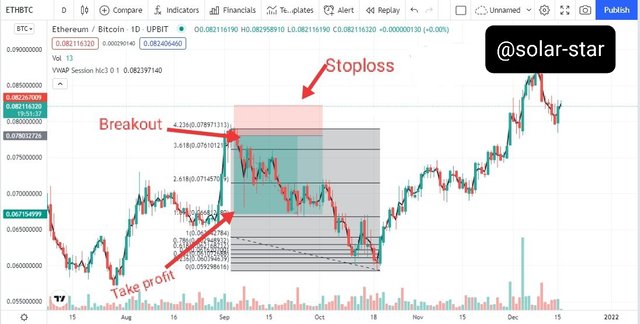
On placing a trade we take note of the break in the current trend whether upwards or downwards. When the break happens after a bullish trend we place a sell order and when the break of the current trend happens after a bearish trend we place a buy order. An important factor is that the VWAP indicator must break and move in the direction of price, this is a key factor while using the VWAP indicator.
- Secondly we consider the retracement to VWAP and the usefulness of Fibonacci
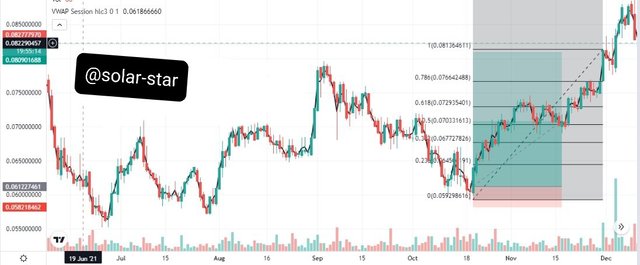
We then consider the retracement, basically we look out for the movement of the price moving towards the VWAP line. As the movement occurs we then use the Fibonacci retracement tool to measure from bottom to top. The points are 50% and 61.8% when the line moves closer to the observed price chart.
.jpeg)
- Thirdly, we consider trade management
Supposedly if the price is within our already set range (50% & 61.8%), the stop lost should be at least below higher range. For instance our last number is at 61.8% then the stop loss should be less than 61.8%. Then the take profit could be 1.5 times the stop loss. Therefore providing traders with utmost profit and low or reduced losses.

Q3.Explain in detail the trade entry and exit criteria to take into account to correctly apply the strategy with the VWAP indicator?

As stated above we consider certain parameters before we are able to apply VWAP correctly, they include
- We take note of the market structure, whether the break in current trend was broken towards the bullish direction or towards bearish direction, this significantly tells us when to place a buy or sell order.
- Secondly we consider the retracement, we observe if price moves near the VWAP line then set a range of 50 and 61.8%. This will signify when the price is in accord we our range it is good for us but viceversa may mean that we may need to exit the trade to reduce losses.
- Thirdly is the Stop loss, which should be after the last number. Based on our range, it should be
below 61.8%.
- Then Lastly, the take profit should be 1.5 times of the stop loss to improve profit and reduce losses.

Q1.Make 2 entries (One bullish and one bearish), using the strategy with the “VWAP” indicator. These entries must be made in a demo account, keep in mind that it is not enough just to place the images of the entry, you must place additional images to observe their development in order to be correctly evaluated.

After reading through this lesson I was able to place my own trade with the knowledge of VWAP indicator.
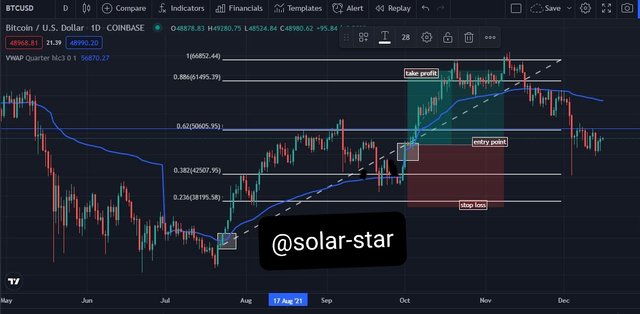
Bullish Trend:
At the exact point at which the VWAP indicator met with the price of the asset which was within my set range of 50% and 61.8% I made a good entry point. It is important to note that the bullish trend basically indicates when the asset is having an uptrend.
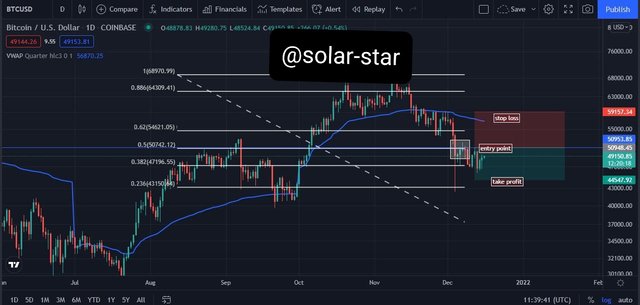
Bearish Trend:
In contrast to the Bullish trend, the Bearish trend signifes a downtrend of an asset. Also in accordance with the bullish and followed our already presumed ranges of 50% & 61.8%.
Conclusion
From the course I have been able to learn the usefulness of VWAP as compared to other types of Indicators. The VWAP manages losses of traders and increases their profit margin. But, VWAP is mostly utilized by day traders because it is mostly calculated for 1M,2M,3H charts that are within a day.
I would like to sincerely thank our professor @lenonmc21 for this wonderful and insightful course. I am hoping to learn more from Steemit Crypto Academy. Thank you and God bless.