Great lecture by @kouba01 on the supertrend indicator, it was nice learning from you. Below are the answers to the assignment, take a look...

1. Show your understanding of the SuperTrend as a trading indicator and how it is calculated?
The knowledge of how most common indicator work in the financial market is of great essence and its importance in the crypto market cannot be overemphasized. Most technical analyst are well vested with the knowledge of so many indicators, this gives them an edge in the market as they do not only depend on a single indicator.
Another indicator of great importance which technical analyst often use when doing analysis is the supertrend Indicator. This indicator is very simple to use and works very well on trending markets ( i.e uptrends and downtrends). Just as the name implies, supertrend is a trend following indicator, it was created by Olivier Seban. It uses two parameters, the multiplier factor and the averge true range (ATR) at a default value of 3 and 10 respectively.
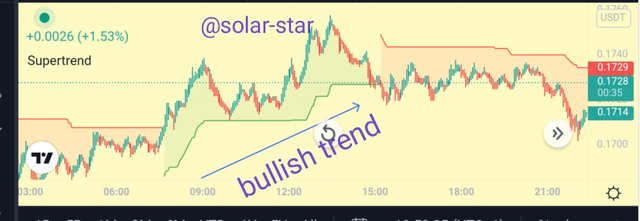
This indicator has two unique properties which serves to to showcase its usefulness. Whenever the line of this indicator is below the price level, the market is obviously on an uptrend and this line serves as the support in such instant. Downtrend is observed when the line is above the price level and they serve as the resistant in that instant.
Supertrend has two colours, the green color and the red. The appearance of a green colour signifies a buy entry while that of red signals an exit. This two colours are evidently seen during the bullish and bearish trend respectively, making it easy for the trader to determine appropriately the entry point and the exit points in the market.
With this indicator,uptrend and downtrend are clearly visible and necessary adjustment can be made at anytime depending on the trade set up.
How supertrend indicator is calculated
The calculation of the supertrend indicator is quite simple and easy to follow. Below are the formula used for this calculation.
Uptrend = (higher + lower)÷2 + factor × ATR (period)
downtrend=(higher+lower)/2 - factor × ATR (period)
For calculation, of the uptrend, the higher price and the lower price are added together and the answer is divided by a value of 2. The value gotten is then added to the product of the multiplier factor and ATR.
For calculation of downtrend, the higher price and the lower are added together and the answer is divided by a value of 2. The value gotten is then subtracted from the product of the multiplier factor and ATR.

2. What are the main parameters of the Supertrend indicator and How to configure them and is it advisable to change its default settings? (Screenshot required)
The two main parameters used by the supertrend indicator are the multiplier factor an the Average true range(ATR). These two parameters are set at a default of 3 and 10 respectively. However, these parameters can be adjusted depending on the trade set up. If the factor is set at 4 or 5, it can delay the signals which is capable of leading to a potential loss of profit in the market. Hence, the numbers should be kept at default to avoid frivolities.
how to add the indicator
• go tradingview.com, open the chart section and add any pair of your choice
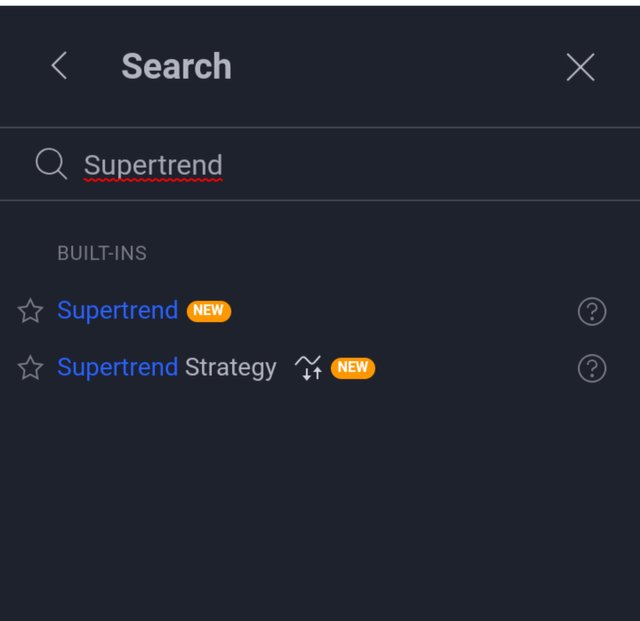
• click on the indicator icon, type supertrend and click on it.
• close the log and return to the chart as the indicator has been successfully.
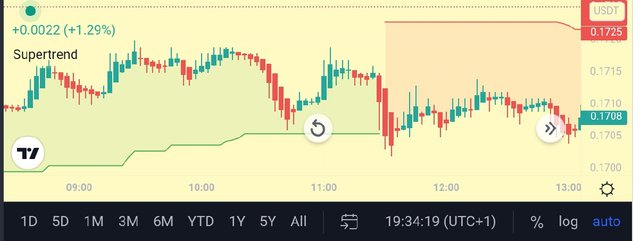
how configure it
• click on the setting icon and a window will pop up just as shown below
• as seen, the default settings for this indicator is and ATR length of 10 and a factor of 3.
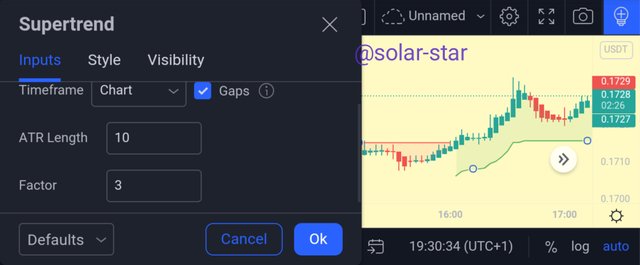
For the illustration purpose, I changed the factor values to both 4 and 5 while comparing their uniqueness.
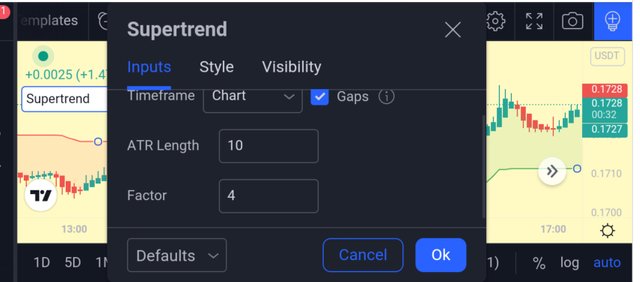
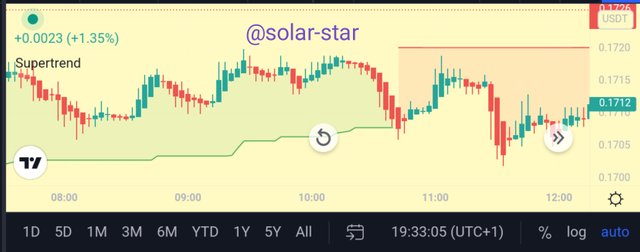
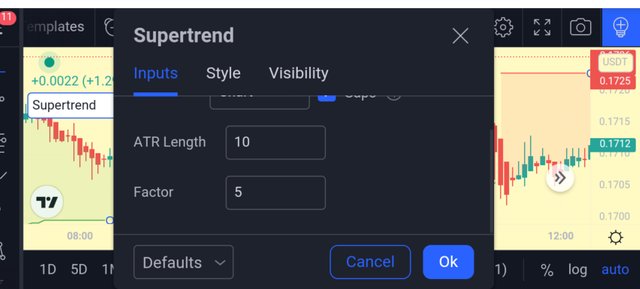
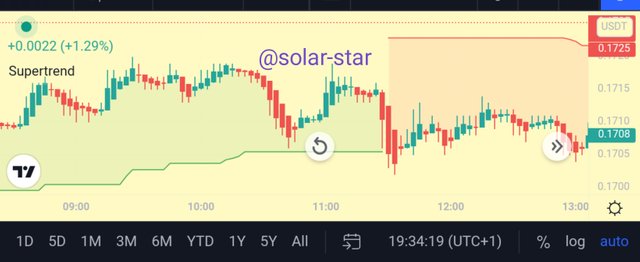
For the default, the signals appeared early, making it quite easy too place an entry. But for 10,4 and 10,5 , the signals showed up a little bit late.
Hence, its not advisable to change the default setting as high factors have the tendency of giving late signals.

3. Based on the use of the SuperTend indicator, how can one predict whether the trend will be bullish or bearish (screenshot required)
The supertrend indicator is less sensitive to volatility and do not reverse its position very easily unlike other indicators. However, its sensitivity can as well be enhanced by adjusting its parameters. Its effective in predicting if the trend will be bullish or bearish. This effectiveness can be reduced if the trade is on a short term.
However, due to its delayed reversal when there is a market change, its most likely to miss out on few market information that could have been of great essence in the market.
Bullish trend
Just like any other indicator, this indicator serves to detect a bullish trend in the market. For a bullish trend, green line are observed in the bands just as shown below. This line appears below the price level and can only be seen on a bullish trend and not the other way round.
Bearish trend
For a bearish trend, a red line is observed, this lines appear above the price level to indicate that the market selling pressure is high. The red line can only appear when the market is on a bearish trend and not the other way round. Hence , traders can easily exit the market to avoid being blown up.


4. Explain how the Supertrend indicator is also used to understand sell / buy signals, by analyzing its different movements.(screenshot required)
The supertrend indicator can be use to ascertain the best possible time to make an entry or exit in the crypto market.
buy signal
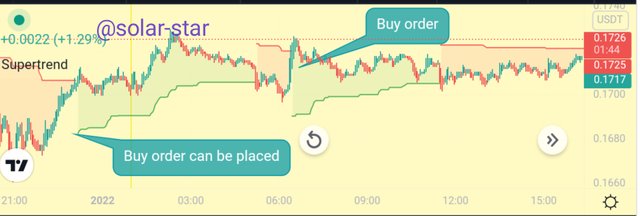
To illustrate the buy signal, I'll be using the cryptopair DOGEUSDT on a 3 min time frame. A buy signal is observed when the green colour appears to indicate a market reversal, this makes the green line to move below the price level just as shown below.
Sell signal
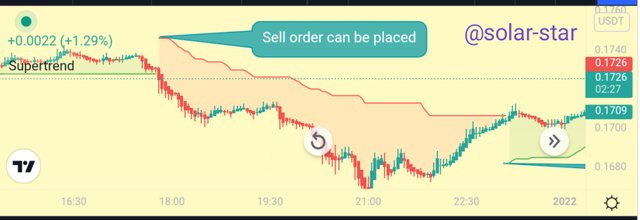
To explain the sell signal, the same crypto pair was used at a 3 min time frame as displayed below,, a sell signal is confirmed when the red colour line appear on the chart and this line moves above the candlesticks to signal a sell order.
This indicator is very easy to use and are often employed by people who trade on the basis of algorithm. Hence, its effectiveness cannot be overemphasized.

5. How can we determine breakout points using Supertrend and Donchian Channel indicators? Explain this based on a clear examples. (Screenshot required)
The supertrend indicator and the donchian channel can be used together to analyse the break out strategy. The donchian indicator are very efficient in determining trend reversals when use with supertrend indicator, they both identify the break out point in the financial market.
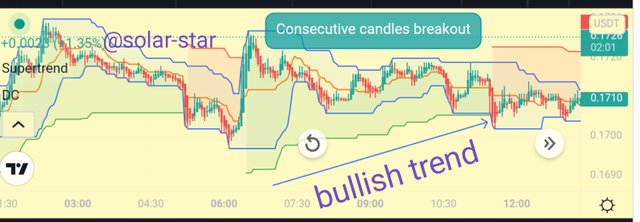
In this strategy, the donchian indicator identifies when there is a trend reversal from bearish to bullish or likewise when the reversal occurs from bullish to bearish. This is very important in the crypto market as signals for long position can be ascertained. In order to identify the break out point, we look out for 2 consecutive candlesticks that comes out of the doinchian channel while supertrend will serve as the trend filter.
Buy entry
Just as explained earlier, to determine the bullish break out, two consecutive green candles must break out of the upper band of the donchian channel, this must also be confirmed by the supertrend as the market must currently be in an uptrend with series of higher highs observed with the green colour. When this happens, a trader can take a buy entry as observed below.
Sell entry
To determine the bearish break out, two consecutive red candles must be seen break out from the lower band of the donchian channel, this must also be confirmed by the supertrend as the market must currently be in a downtrend with series of lower lows observed with red colour. When this happens, a sell signal is confirmed and a trade can be placed.


6. Do you see the effectiveness of combining two SuperTrend indicators (fast and slow) in crypto trading? Explain this based on a clear example. (Screenshot required))
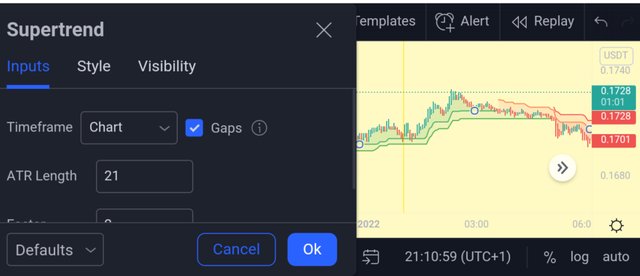
When two same indicators are combined, in a chart, the outcome is always to enhance the effectiveness of such tool as we have seen with the EMAs. Same is also applicable with the supertrend indicator. When this fast and slow indicators are combined together, it has the tendency of increasing the efficiency of the tool. This tool Can be added same way as the first one and the default settings changed to ATR lenght of 21 and a factor of 2, While maintaining the default setting of 10,3.

Buy signal
In other to confirm a buy signal, the market must be in an uptrend and the two lines must show green and must be rising upward , such that the two green lines fall below the price levels. The market must be bullish. When this happen, a buy signal is confirmed.

Sell signal
To confirm a sell signal, the market must currently be in a downtrend and the two lines must be red. They must also rise above the price level which shows that the price is declining. When this happens, a sell order can be conveniently placed.


7. Is there a need to pair another indicator to make this indicator work better as a filter and help get rid of false signals? Use a graphic to support your answer. (screenshot required)
Ideally, when multiple tools are used on a particular chart, it increases the chances of its effectivenesss and also help coup out false signals as no singular indicator has a 100% accuracy. Hence, there is always a need to pair the supertrend indicator with another indicator.

An indicator of choice for this illustration is the RSI. the RSI is another useful indicator that can work very well with the supertrend while helping to filter false signal just as illustrated below
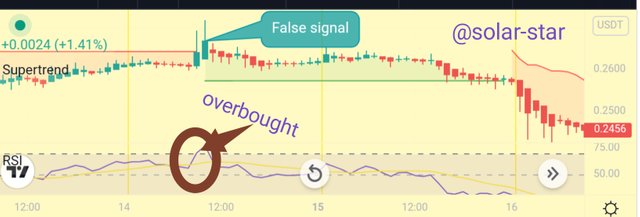
This indicator helps to identify entry points, when the market is in an oversold region, just as shown, it gives an early signal so as to serve as a filter. This indicates that an intending bearish trend is eminent. This two indicators can be used perfectly well to confirm market entry points as well as exits. This two wonderful indicators is of great essence in the crypto market.

8. List the advantages and disadvantages of the Supertrend indicator
Advantages
• This indicator is very efficient and helpful for intraday traders as they can quickly make their decisions.
• It is easy to use and available on many platforms at relatively no cost.
• It is precise and accurate in determining signals.
• It also offers clarity as the signals are easy to understand and not ambiguous
Disadvantages
• It can only be successful on a trending market.
• It uses two parameters of multiplier factor and ATR. hence, its not effective on certain trade set up
• It cannot be used on all trade situations
• It may not be 100% accurate when used alone.

The knowledge of supertrend indicator is very important in the crypto market. Technical analysts utilize its uniqueness to make quicker and faster decisions as regards market situations.
However, no single indicator is 100% efficient hence its always advisable to use it in combination with another indicator. Since it is not accurate in all market situations, itd always advised to apply it only after testing it with different parameters.
This indicator is of great essence and its understanding is very vital especially for intending technical analysts.
P.S: all photos used on this post are screen shots from the official site of trading view
Congratulations, your post has been upvoted by @scilwa, which is a curating account for @R2cornell's Discord Community. We can also be found on our hive community & peakd as well as on my Discord Server
Felicitaciones, su publication ha sido votado por @scilwa. También puedo ser encontrado en nuestra comunidad de colmena y Peakd así como en mi servidor de discordia
Downvoting a post can decrease pending rewards and make it less visible. Common reasons:
Submit