Greetings to everyone, I want to commend the efforts of @utsavsaxena11 for putting together such a great lesson on Ultimate oscillator indicator. It was indeed a great lesson. Below are the answers to the homework. Take a look...


Indicators are technical tools usually added to crypto charts in order to enhance the understanding of trade pattern as well as trends in the market. An indicator of great relevance in today's work is the ultimate oscillator. This indicator was crested by larry williams in the year 1976 to help in the measurement of price momentum of an asset across different time frames. What makes this indicator most unique is its ability to use use three different time frames (7, 14 and 28 period ) for its analysis.
In addition, this indicator has less volatility and also gives fewer trend signals as compared to other indicators, this is due to its ability to measure price of an asset across multiple time frames. The shorter time frame has a greater weight than the longer time frame in the calculation.
This indicator is efficient in determining both buy and sale signals. A buy signal is observed when there is a bullish divergence while a sale signal is observed when there is a bearish divergence.
For the calculation of ultimate oscillator, we usually make use of a particular formula. This formula is a bit complex but can still be followed
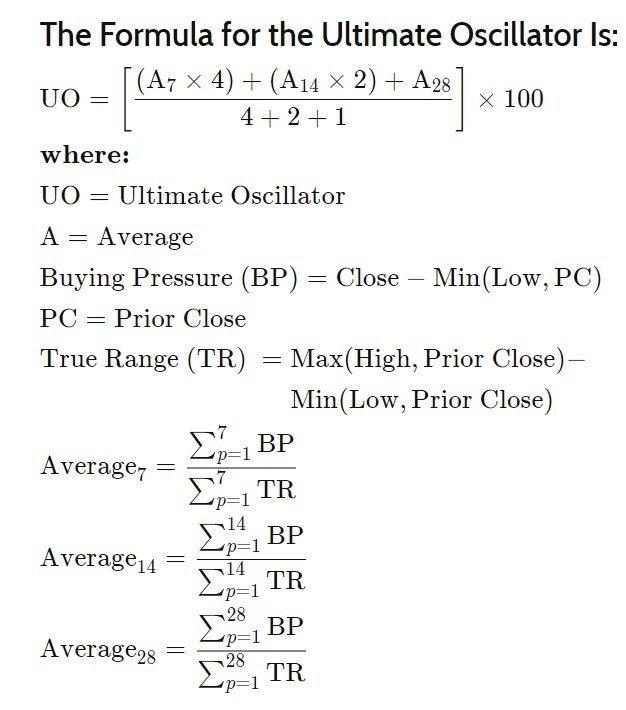
• For the calculation of ultimate oscillator, the buying pressure is first calculated for the three periods i.e 7,14 and 28 to create a BP sum.
• secondly, the true range (TR) is calculated by subtracting the current periods high or prior close from the lowest value of the current period's low or the prior close for the three time frames and summed up to create TR sum.
• thirdly, the average 7, 14 and 28 is then calculated using values from the BP and TR sums.
• the ultimate oscillator is then calculated using the average 7,14 and 28 values and their weight in the denominator are all summed together and multiplied by 100 just as shown in the formula given earlier.
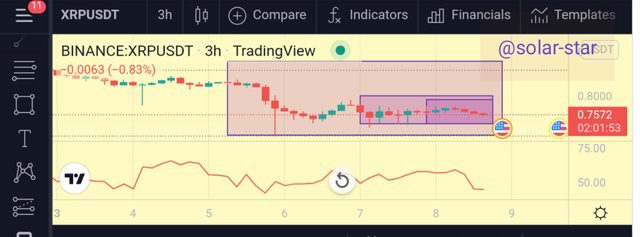
I will start my calculation by calculating the values of BP and TR from the chart above
| n periods | BP | TR |
|---|---|---|
| 1 | 0.00573 | 0.0092 |
| 2 | 0.0012 | 0.0091 |
| 3 | 0.0014 | 0.0101 |
| 4 | 0.0029 | 0.01415 |
| 5 | 0.011 | 0.0106 |
| 6 | 0.0069 | 0.0142 |
| 7 | 0.0112 | 0.0223 |
| 8 | 0.0062 | 0.0112 |
| 9 | 0.0292 | 0.0371 |
| 10 | 0.02 | 0.0326 |
| 11 | 0.0025 | 0.0195 |
| 12 | 0.0291 | 0.0408 |
| 13 | 0.023 | 0.035 |
| 14 | 0.0009 | 0.0179 |
| 15 | 0.0012 | 0.0129 |
| 16 | 0.0137 | 0.0205 |
| 17 | 0.0131 | 0.0158 |
| 18 | 0.0158 | 0.0234 |
| 19 | 0.0112 | 0.0189 |
| 20 | 0.004 | 0.0144 |
| 21 | 0.0143 | 0.0216 |
| 22 | 0.0014 | 0.0092 |
| 23 | 0.0632 | 0.0913 |
| 24 | 0.0095 | 0.0461 |
| 25 | 0.0008 | 0.0109 |
| 26 | 0.0073 | 0.0095 |
| 27 | 0.0011 | 0.0168 |
| 28 | 0.005 | 0.009 |
• A 7 = 0.0403/0.0896 = 0.45
• A14 = 0.111/0.262 = 0.42
• A28 = 0.1688/0.3074=0.55
Now to calculate the ultimate oscillator value, we make use of the formula
• UO = ((A7 * 4)+(A14 * 2)+(A28))/7)*100
• UO = (0.454)+(0.422)+(0.55)/7)*100
• UO = (1.8+0.84+0.55)/7*100
• UO = (3.19/7)*100
• UO = 0.4557*100
• UO = 45.57
From the calculations, it has been shown that the value of UO as obtained from the chart is 45.57.


The basic function of all indicator is its ability of determining market trends. How effective and accurate this can be, is dependent on the indicator used. For the ultimate oscillator indicator, identification if market trends is quite simple and easy to follow. Its efficiency is based on two market concepts i.e oversold and overbought conditions experience in the market.
Uptrend
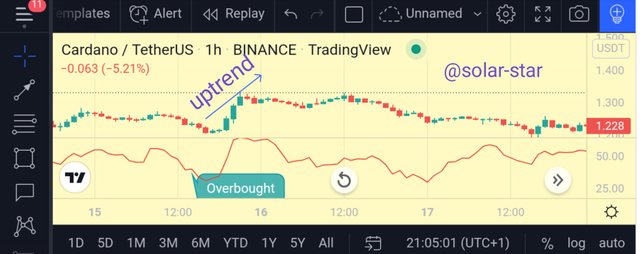
To identify an uptrend using this indicator, the crypto pair ADUSDT was employed on a 1h timeframe. As observed below, an uptrend occurs immediately after the indicator entered an oversold region of below 30 level indicating that there's an intending surge in the price level which subsequently results in an uptrend.
Downtrend
As was indicated for uptrend, the crypto pair Adausdt was employed on a 1hr timeframe
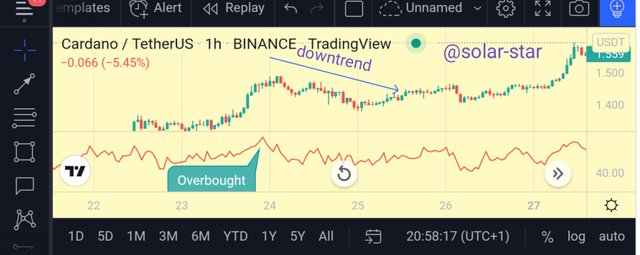
As seen from the photo above, a downtrend was observed after the indicator recorded an overbought signal of the asset which was above 70 indicating that the crash in the asset's price is imminent .
| Ultimate oscillator | slow stochastic indicator |
|---|---|
| The UO has three time frames i.e (7,14 and 28) | It has only one time frame. |
| Signal lines are absent in OS | signal line are present. |
| The UO uses a three step procedure for trading divergence | it has only one step in trading divergence. |


Divergence is simply when the price of an asset is moving in an opposite direction to that indicated or shown by the indicator. It is an important concept in the financial market.
A divergence can either be bullish or bearish just as indicated below
Bullish divergence
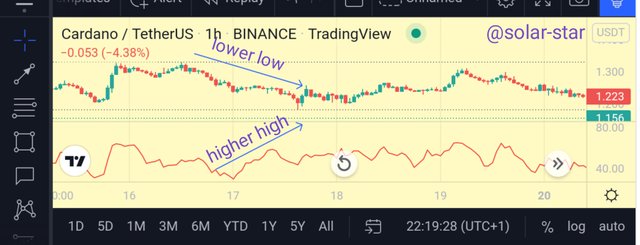
A bullish divergence is often experienced when using the ultimate oscillator. In this case, it occurs when there is a lower low in the price level but the UO is showing a higher high just as observed below
Bearish divergence
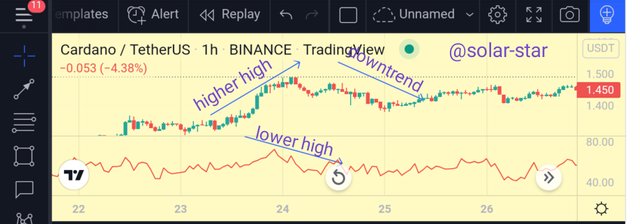
This divergence is observed when the price levels showing an higher high and the UO is showing a lower low, meaning that the price is experiencing a downtrend.
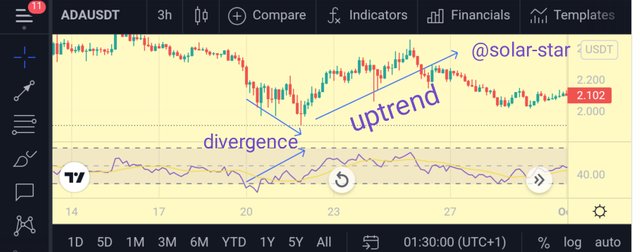
Apart from the ultimate oscillator, another great indicator that can be used for the identification of divergence in the market is the RSI indicator. This indicator is mostly used by technical analysts and is very efficient in that regard.


Determination of entry points and exit points in the crypto market is a fundamental part of all indicators. However, different indicators have their own unique procedure of doing this. The ultimate oscillator uses a three step approach for the confirmation of buy and sell signals .
This approach is very vital because it uses both the divergence and non divergence condition to filter off false signals and give an accurate signal for a buy or sell signal.
Buying signal
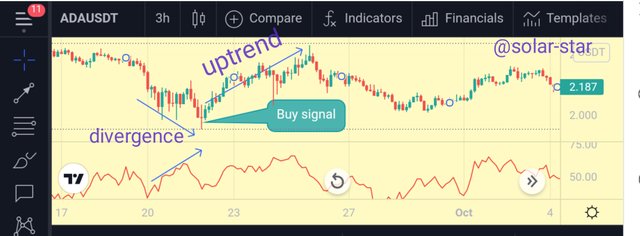
In order to determine a buy signal using this indicator, 3 things must be observed concurrently. They include
• Firstly, a bullish divergence must be confirm. This is when the price makes a lower low while the indicator makes a higher high.
• Secondly, the first low (the lower one) in the divergence must be below 30. This indicates that the divergence began in an oversold region which will subsequently lead to an uptrend
Sell signal
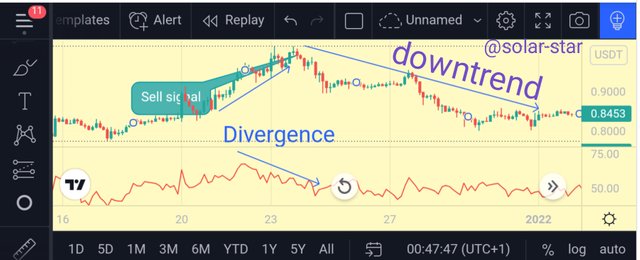
To illustrate the sell signal using this indicator, a cryoto pair XRPUSDT was employed on a 1min time frame. To confirm a sell signal, three things must be observed concurrently. This includes
• A bearish divergence must be confirmed. This is when the price makes a higher high and the indicator makes a lower high as observed below

What is your opinion about ultimate oscillator indicator. Which time frame will you prefer how to use ultimate oscillator and why?

Ultimate oscillator is a very good and reliable technical indicator, but just like all other indicators, it also has its own limitations. The indicator can sometimes eliminate some good trades due to its 3 step trading procedure which was designed to help filter off some poor trades. In addition, the divergence is not always present on all price reversal points which can also reduce the accuracy of the indicator. Always waiting for the indicator to go below the divergence low as in bearish divergence or to go above the divergence's high as in bullish divergence could result in poor entry points as the prices must have already surge in the opposite direction.
Generally, the indicator is easy to understand, but should always be used with another indicator like EMAs in order to enhance its efficiency as no single indicator is assume to be 100% accurate.
I will prefer the use of multiple time frame i.e 3 time frames for this indicator to function effectively. This will help to eliminate false divergence which is a common occurrence in UO that uses a single time frame.

conclusion
The knowledge of this indicator is very important and vital in crypto trading as it will help increase the options when it comes to choosing a good indicator. The indicator is very effective when used in a 3 time frames and serves to filter out false signals in the market.
However, it should always be combined with another indicator to increase its accuracy as no single indicator is 100% accurate