
Image created by me on Canva
Warm greetings to @sachin08, I am so delighted to participate in respect to your lesson titled [Trading Using Wedge Pattern], although this is my first time to be part of it. truth be told after going through the lesson again and again I came to the post of understanding what it actually entails which I have proved in my Homework task as seen below.

Now let's get busy with the business of the day.
- The Wedge Pattern.
Wedge pattern as the name implies is a specific variety of trading chart structure that helps traders to be vigilant and sensitive of an inevitable market behavior neglecting the fact of being it the market takes a new turn regarding the previous pattern or continues in the same way which as a result depend on the outbreak/escape direction from the wedge.
Also, the Wedges pattern occurs when the price in respect to the market continues to avail or execute a lesser value range.
The Wedge pattern can also be either a rising wedge or a falling wedge. they are also viewed to have the shape of an angle that comprises both an uptrend and a downtrend having the value waves being more limited or restricted so within that point in a short while there can be an expectation of an outbreak. the value waves are located in the wedge. below is an image analysis of the rising and falling wedge
The wedges pattern helps one in understanding with no doubt that they ain't hard to realize on the chart when viewed. it can as well give out both the reversal and continuation layout which means that the cost can emerge from the wedge and continue in the prior trend of the resource. and s such there will also be a breakout of the price from a wedge and end a trend, then follows the direction of a new trend.

2- What is a Rising Wedge
Already I have mentioned the types of wedges, which are basically two types are they are **Rising wedge and also the Falling wedge, which I am going to further elaborate for more assimilation.
It is a type of wedge that happens simultaneously when there is a rise in the market price, still, the market waves continue to be limited, which entails that the wedge continues to go down and lesser.
The rising wedge occurs simultaneously in a particular state when the value activity is ongoing uptrend position, still, the shrinking market motion reveals that the uptrend strength is reducing, and at such point, it is been viewed that the wedge is rising, and as such we can now make use of the breakout to imply that a falling or surly tendency is on its way.
Note that at a point during the rising of the wedge in an uptrend market, it displays comfort in the energy also may likely to calculate a time ahead deep in market cost. A reduction in the market price occurred immediately the market behavior is demoted underneath the rising wedge.
know this, during the point when a rising wedge occurs in a particular downtrend motion, the market price rises upward and as such might retract a downfall against the downtrend.
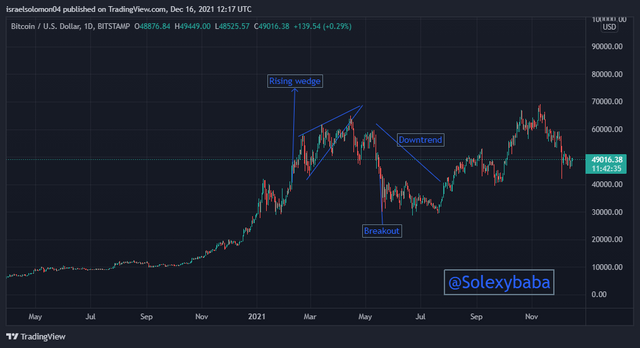
Rising Wedge-TradingView
Below are some key points to help us in identifying a wedge and they are as follows.
1- The level where the pattern disintegrates must be more than or beneath average compared to what we have seen in the wedge structure.
2- Normal the support line always further when compared to the resistance with higher lows in a rising wedge.
3- The upturn notification will generally become more contract, which will lead to an inversion into the falling movement.
4- A rising wedge is expected to see a minimum of two rising lines come together in an upturn/uptrend.

The Falling Wedge
It takes place when two falling lines are joined in a downtrend market. these lines in question usually pass through a minimum of two lows and highs and also pass through the support and resistance levels. the falling wedge is commonly known as the bullish version of the wedge pattern which can simply be known by its downward structural view.
It is also formed at either the bottom or the end of a downtrend and as such leads to the commencement of an uptrend which is regarded as a reversal.
In falling wedge the slope of the trend line that represents the highs is always lower than that of the trend line which represents the lows, showing that the highs are reducing extremely than the lows.
For a falling wedge to be formed, it requires a minimum of five reversals in which two are meant for one trend line and three for the other tread line.
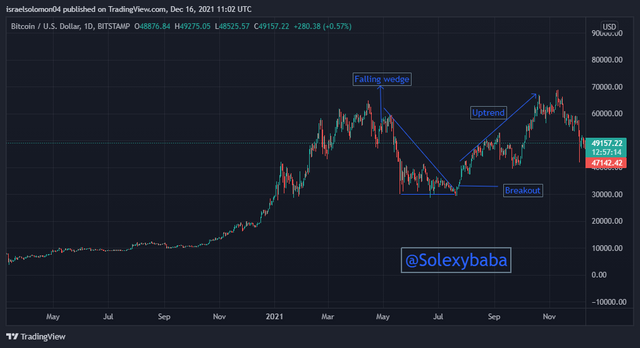
Falling Wedge - TradingView
We can identify a falling wedge based on the tips below.
1- One has to link the lower highs as well as the lower low with the use of a trend line.
2- One needs to identify either an uptrend or a downtrend.
3- one has to search for a divergence between price and an oscillator either like the RIS or the stochastic indicator.
4- The oversold signal can as well be affirmed technically using other technical tools like oscillators.
5- Falling wedge has the features of a chart pattern that forms when the market lower lows as well as lower highs with a contracting range. that is to say when the pattern is located in a downward direction pattern then it is noted to be a reversal pattern, hence the contraction of the range means the downtrend is losing steam.

Do the breakout of these Wedge Patterns produce False Signals at times?
of course, The breakthrough pattern does produce false signals although not always but it should be noted that this action does not always happen as the pattern is totally on the basis of the trend that is to say they occur depending on the market movement.
For the false breakthrough to be filtered out, it is recommended one ought to structure the wedge pattern accurately and after that join the pattern alongside other indicators, here I will make use of 200 ema Filtered parabolic SAR indicator in other to checkmate my break affirmation using the following steps below.
1- After searching for the 200 ema Filtered parabolic SAR indicator in the indicator search menu, click on the enter key.
2- Immediately the indicator will be added to the chart, so all you need to do is to go ahead in locating the correlation in between the pattern break out to checkmate if it does correlate with the pattern or not.
Below is the rising wedge Break out affirmation.
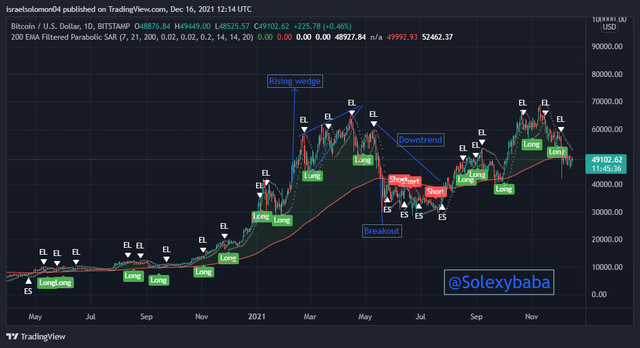
Rising Wedge Breakout -TradingView
So as seen in the image above it is clearly viewed that the market direction after the rising wedge pattern breakout takes a new move in the bearish after the action and that we have seen with the help of the 200 ema Filtered parabolic SAR indicator that has shown the correct affirmation to the pattern break out.
We all know that a bullish trend is likely to occur immediately after a falling wedge ended in which the pattern in this manner break later. so we can accurately see in the above image, immediately the market finishes its grouping or joined together and then breaks out, the correlation of the bullish trend in between the various indicators and the wedge plan is shown vividly. as such the affirmation in this signal to where we stand is given.
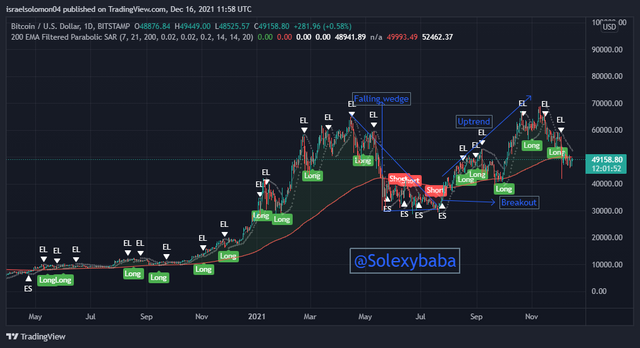
Falling Wedge Breakout -TradingView
Now the False Breakout
The Falling wedge pattern does give a false sign when is structured on a given chart whereby a bullish trend is likely to occur but the situation is not the same as seen in the image below, technically we all can see that the trend breaks to the bearish point which is not as expected and as such confirms that the wedge pattern some times provide false signals that is why it is highly recommended to make use of an indicator to checkmate the wedge pattern.
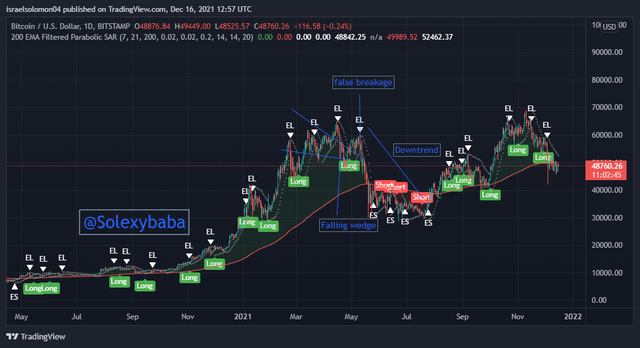
Falling Wedge false Breakout -TradingView

Trade setup for Rising Wedge.
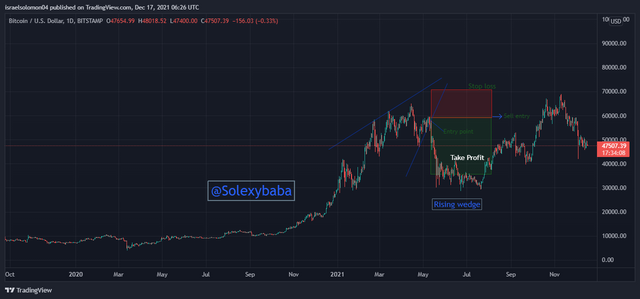
Trade setup using Rising Wedge - TradingView
As seen in the above image, clearly the Rising wedge is created, we can use it to set the entry point to sell in as much as the input variables are well situated.
When the rising trends are showing a possibility to break out at this point. an entry to sell is made so we place a particular position and also just above the break out a stop-loss is set as well., the stop-loss should be set accurately at a particular ratio one is willing to risk afterward. for us to avoid casualties resulting in loss, just underneath the wedge a take out profit is set in other to gain.

Trade setup for Falling Wedge
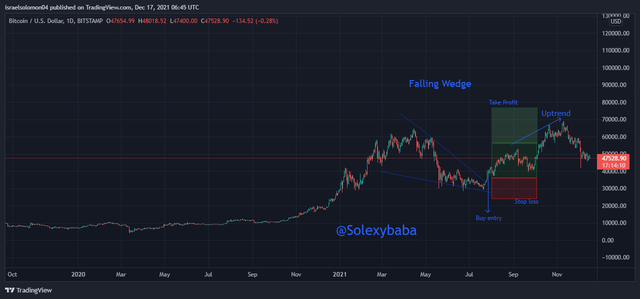
Trade setup using Falling Wedge - TradingView
The above image reviewed how my buy entry was made immediately after the falling wedge broke out, also my stop loss as seen beneath the wedge alongside my buy entry, again a take out profit is set which is located just above the wedge. All this can only be effectively achieved when the necessary parameters are not compromised, so care must be taken.

Conclusion
The Wedge pattern is necessary if, at all you want to make a precise entry and exit from a trend, it is also simple to make use of this pattern involve little risk when making a trade-in with respect to the direction of the trend in question. as we all know in the course of this work, the Rising wedge and the Falling wedge are the two types of a Wedge pattern, and they both review to traders the precise time to make entries at the break out point.
Thanks to professor @sachin08 for this great, wonderful and interesting lecture.
.jpg)
OG, go look the cover page of the level wey u just submit and this one
Downvoting a post can decrease pending rewards and make it less visible. Common reasons:
Submit
thanks big man
Downvoting a post can decrease pending rewards and make it less visible. Common reasons:
Submit