

INTRODUCTION
Good evening Steemians , I will be responding to assignment given by professor @reminiscence01 " Psychology of Trend Cycles" . so lets begin.

1. Explain your Understanding of the Dow Jones Theory. Do you think Dow Jones Theory is Important in technical analysis?

Charles Dow propounded the Dow theory on technical analysis which revolve round the market trends. Dow Jones Theory was the first theory to talk about market trends either uptrend or downtrend at a given period of time .The theory says that one can predict the future of any asset by just going through the information of the token.
Dow theory asserts says the market trends are composed of three phases:
- Accumulation phase
- Public participation (or absorption) phase, and
- Distribution phase
The Dow theory believes that supply and demand always control the market, the Dow theory believes when the market is bullish, we get to witness more indices of value than the former one, and the same also goes for a bearish market. The Dow theory accustomed its theory with the market volume,
Yes, I strongly believe that Dow is important in technical analysis because we can predict the price movement in market trends by using the Dow theory.
Dow theory helps traders or investors in a way that they can understand and predict the market movement or trends so as to know when to buy or sell.

In your own words, explain the psychology behind the Accumulation and Distribution phases of the market. (Screenshots required).

Market is basically of two types which are Uptrend and Downtrend movement but during the course of this movement it also tends to experience some phases which are the
- Accumulation phase and
- Distribution phase.
Accumulation Phase:
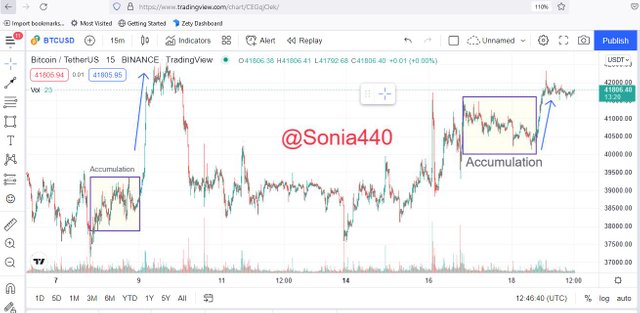
The is the period where people tends to enter the market the more, in this phase we see more buyers than seller in the market. We also tends to have more buying pressure and good volume in the market which will lead to bullish movement of the price an assets. After accumulation phase we tend to have increase in the price of the asset.
At the accumulation phase investors are just interested to open a buy order so as to accumulate the assets whereby making the market to make an uptrend movement.
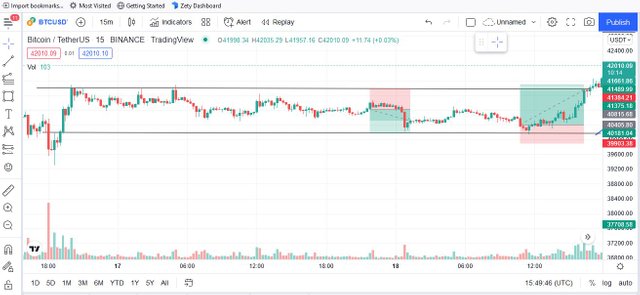
From the above image, I pointed out the accumulation phase .and just after the accumulation phase you notice a spike in price of the assets or bullish movement.
Distribution Phase:
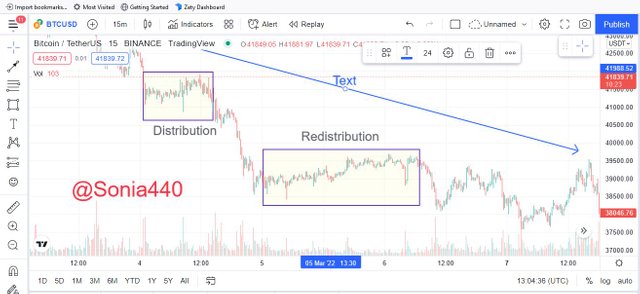
This is the phase where traders that enter the market close their trade. Those that accumulated an assets during the accumulations phase are prepared to sell to sell off, this is where investors cash out their funds because the price of an assets falls immediately after distribution phase .
During this phase, we tend to have more selling pressure which results in the downtrend of the assets. WE can also notice redistribution phase here, where the price try to fall but retrace back.
From the above image, I pointed out the distribution phase .and just after the distribution phase you notice a fall in price of the assets or bearish movement and can also see redistribution where the assets is try to price but the pressure is much.

Explain the 3 phases of the market and how they can be identified on the chart.

From Dow Theory crypto market can either be in uptrend or downtrend movement but if it is not found in the two trend then it is in ranging market. so basically market can be seen in:
- Bullish Phase
- Bearish Phase
- Ranging Phase
Bullish Phase
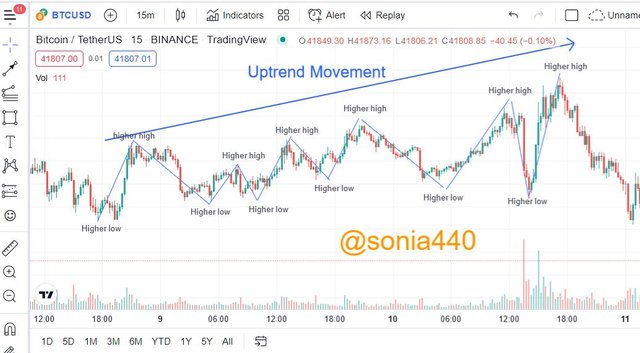
A bullish movement when the market making more higher highs movement than the previous , The price of an asset is going up the crypto market, we tend to have more buyers than sellers . We have more buying pressure than selling pressure.
Bearish Phase
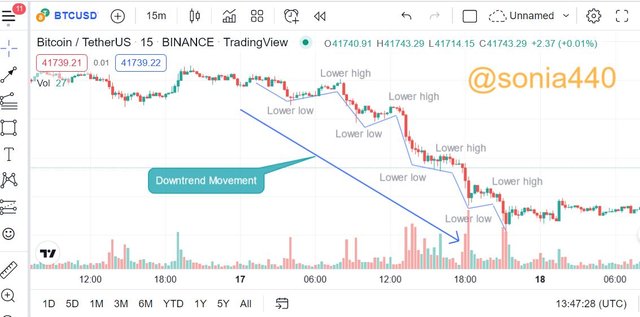
A bearish movement when the market making more lower high and lower low movement than the previous , The price of an asset is going down the crypto market, we tend to have more sellers than buyers . We have more selling pressure than buying pressure.
Ranging Phase:
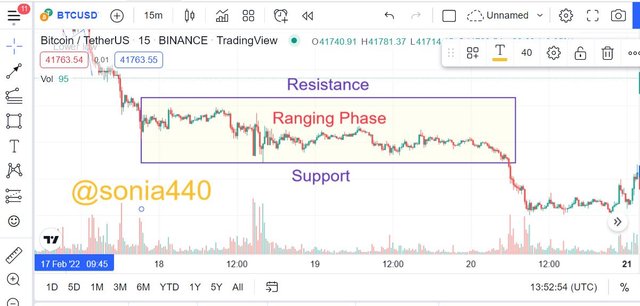
In this phase market is either in accumulation or distribution zone ,The market just concluded a trend and about to start a new trend , This phase market is shuttling between the support and resistance before it eventually breaks out.

4. Explain the importance of the Volume indicator. How does volume confirm a trend? Do this for the 3 phases of the market (Screenshots required)

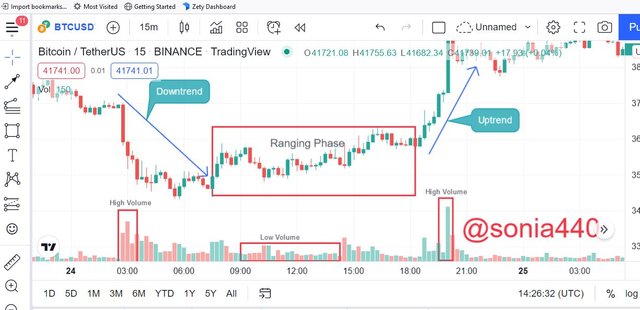
The Volume indicator is one of the important indicators used by traders to determine the of the amount of buyers and sellers in crypto market, with the volume indicator you can easily identify the amount of assets being purchase or sold the market, during a busy market, we ted to see high volume while in ranging market tend to see low volume because the market is balanced between the buyers and sellers .
Volume is used to confirm If there is increase or spike in price of an assets. When the Volume is green, it shows that buying pressure is high and also an uptrend is about to take place. When volume bar is the red, it shows that the selling pressure is high , it signifies that downtrend is about to take place.
When the volume is low it signifies of low volatility which indicates Ranging phase thus Market is in Accumulation or distribution Phase.
From the screenshot above, You discover an uptrend at the level of increasing volume bars, low volume at ranging phase and increasing volume at the level of downtrend.

5. Explain the trade criteria for the three phases of the market. (show screenshots)

Below is the trade criteria for the 3 phase discussed above:
Bullish Trend
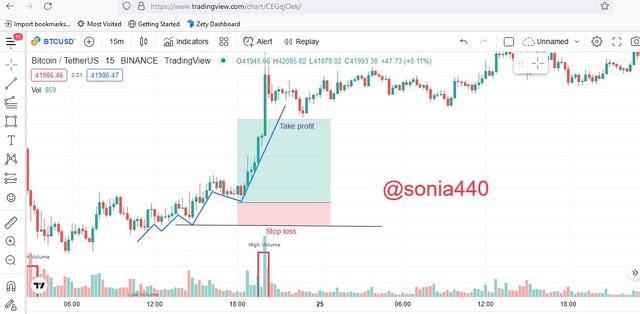
The first thing to do is to identify the market movement or confirm is an uptrend movement by locating the highs and lows in the trend. If we spot a higher highs and higher lows we can place a buy position.
We can also place our trade base on the higher high movement ,we can open our trade after the previous high in uptrend movement.
We set our risk reward ratio to 1:1 or 1:2.
Bearish Trend
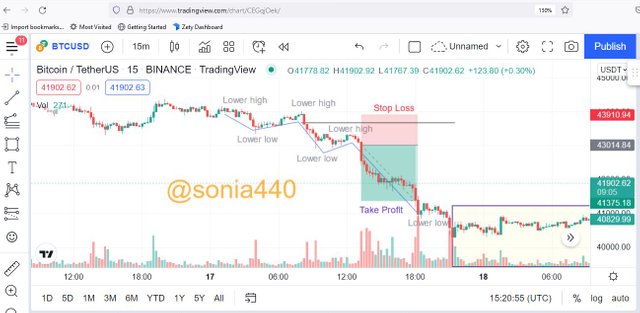
The first thing to do is to identify the market movement or confirm is an downtrend movement by locating the highs and lows in the trend. If we spot a lower highs and lower lows then we can place a sell order.
We can also place our trade base on the lower highs movement ,we can open our trade after the previous lower highs in downtrend movement.
We set our risk reward ratio to 1:1 or 1:2.
Ranging Phase
In this ranging phase market is just shuttling between support and resistance and it's too risky because a breakout might take place and the volume is too low.
- We can place our buy at support level and our sell order at the resistance level.
- We can set our stop loss below the support level in buy and our stop loss above the resistance in sell order.
With the Trade criteria discussed in the previous question, open a demo trade for both Buy/ Sell positions.

For this part I will be trading ETHUSDT pairs using trading view for my analysis using volume indicator and meta trade 5 for my trading.
Buy Trade on ETH/USD
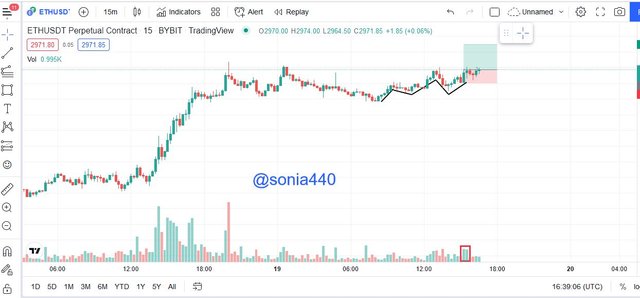
From the image below, I discovered that there is increase volume as you can see in the above image So, I predict that price is going to go up
Screenshot from Metatrade5
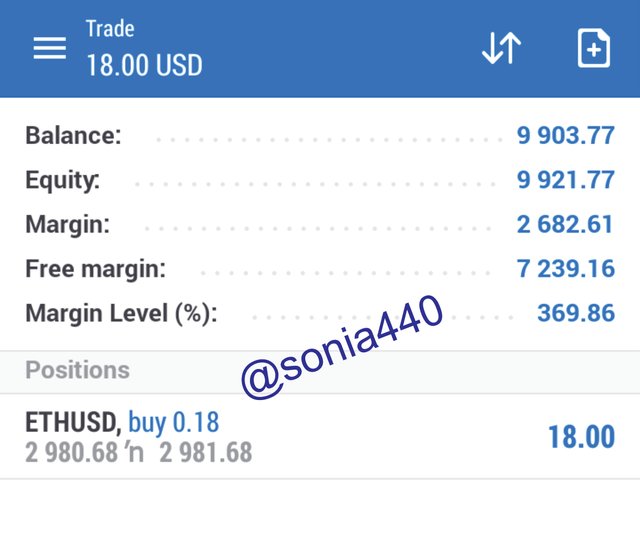
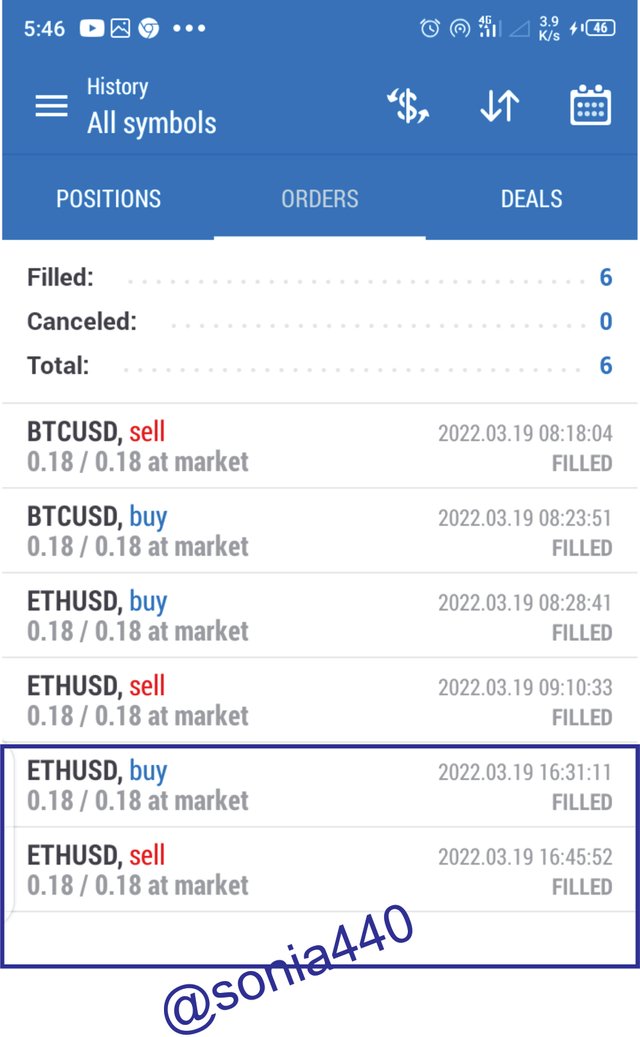
Sell Trade on XRP/USD
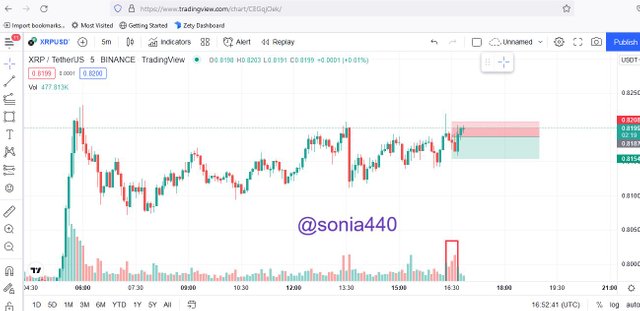
From the image below, I discovered that the market was in bearish. The volume indicator also confirmed that, so I open a sell position. I executed the sell position on XRP/USD.
Screenshot from Metatrade5
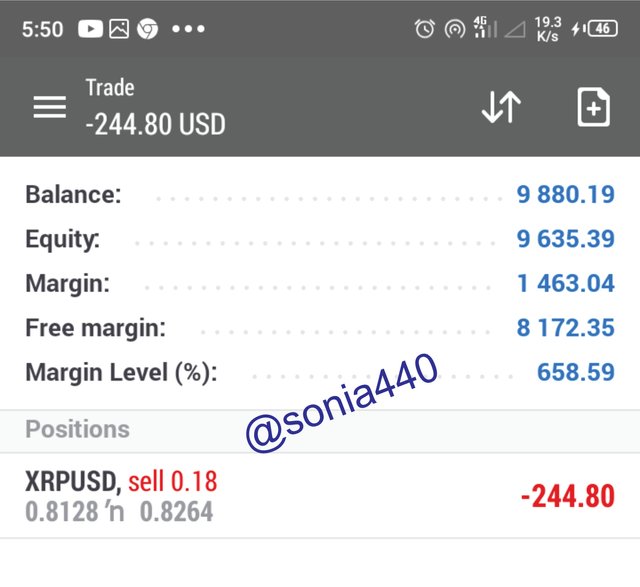
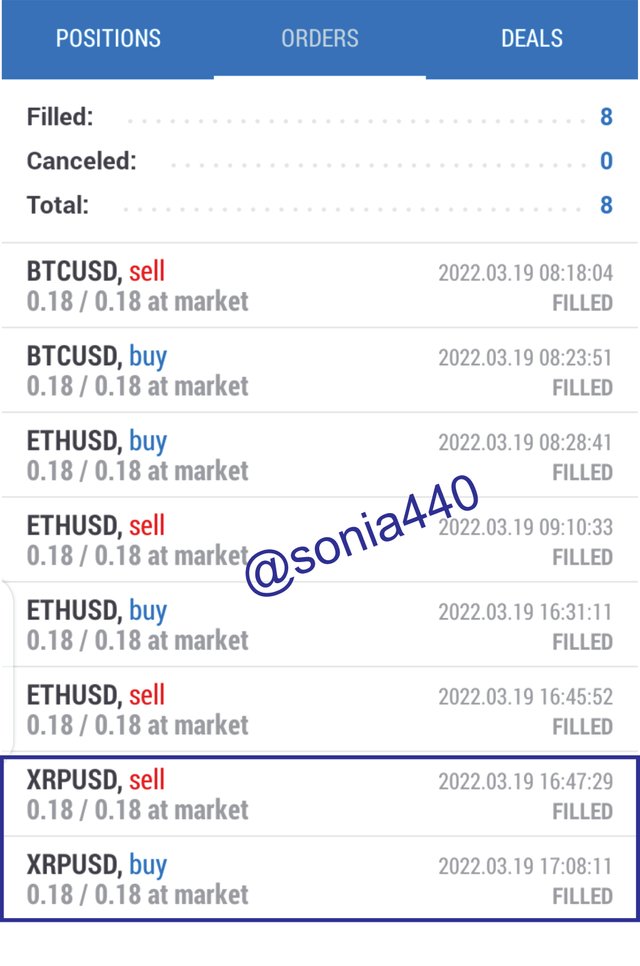
Conclusion
Technical Indicators are very useful to traders in technical analysis because a Good Trader can't make a good trading decision without making use of indicators in the market to trade. We have so many Technical indicator for making good trading decision in the market.
Dow is important in technical analysis because we can predict the price movement in market trends. Dow theory helps traders or investors in a way that they can understand and predict the market movement or trends so as to know when to buy or sell.. Thanks professor @reminiscence01 for this great lecture.

Downvoting a post can decrease pending rewards and make it less visible. Common reasons:
Submit
Hello @sonia440 , I’m glad you participated in the 4th week Season 6 at the Steemit Crypto Academy. Your grades in this Homework task are as follows:
Observations:
This chart is incorrect for a distribution phase.
Recommendation / Feedback:
Thank you for participating in this homework task.
Downvoting a post can decrease pending rewards and make it less visible. Common reasons:
Submit